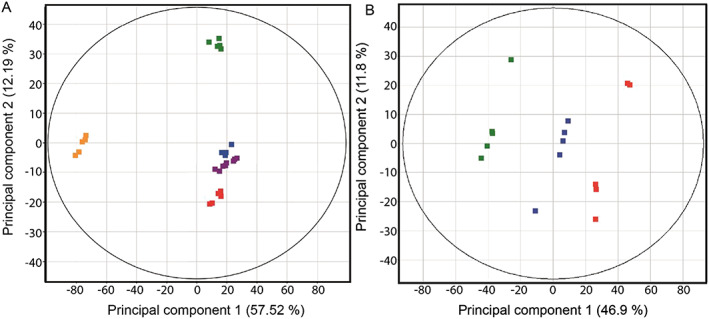
Figure 2.

A, PCA of the DI‐HRMS spectra of the upstream ( ), sewage outfall (
 ), downstream (
 ), blank (
 ) and mixed quality control (
 ) DOM extracts. B, PCA of the DI‐HRMS spectra of the upstream (
 ), sewage outfall (
 ), and downstream (
 ) DOM extracts
