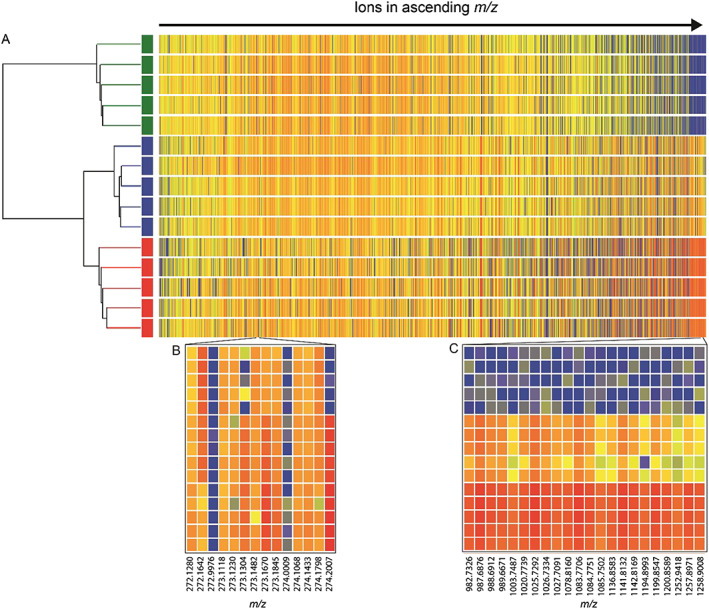
Figure 3.

A, Hierarchical cluster analysis of the upstream ( ), sewage outfall (
 ), and downstream (
 ) DOM extracts and heatmap of the ions detected in the DI‐HRMS. Comparison of the log2 of the intensity of the ions represented by colour with higher intensity hotter (red) and lower intensity colder (blue). Two narrower mass ranges B, m/z 272.0 to 274.5 and C, m/z 982.0 to 1259.0 from the heatmap
