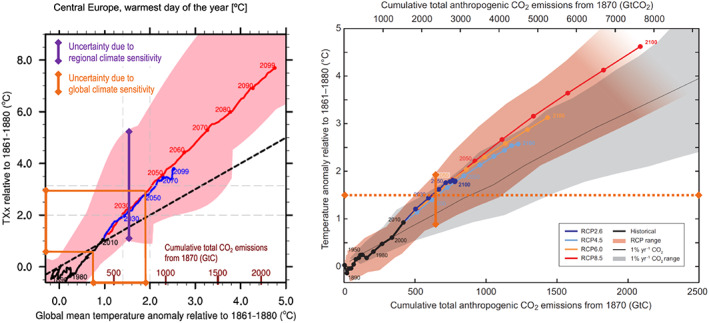
Figure 1.

(left) Regional climate sensitivity of changes in annual hottest daytime temperature (TXx) in Central Europe (CEU, see Supporting Information, Figure S1) in the fifth phase of the Coupled Model Intercomparison Project (CMIP5), derived from empirical scaling relationships (ESRs) as a function of global warming (source: Seneviratne et al. 2016). The blue (red) line indicates the multimodel mean of the RCP4.5 (RCP8.5) CMIP5 simulations. The spread in the ESR response at +1.5°C of global warming is shown in violet and spans approximately 4°C (from 0.91°C to 5.06°C, see Table S1). The regional CEU spread in TXx resulting from the uncertainty in global (transient) climate sensitivity (also termed global transient response) based on the IPCC AR5 (see right‐hand panel) is indicated in dark orange and spans about 2.5°C. (right) Global mean surface temperature increases as a function of cumulative total global CO2 emissions from various lines of evidence (source: Figure SPM.10 of IPCC AR5 working group 1 report (IPCC, 2013), based on the CMIP5 ensemble; modification: dark orange lines indicate the response at +1.5°C of global warming and the respective spread in the CMIP5 RCP simulations). The figure shows multimodel results from a hierarchy of climate‐carbon cycle models for each RCP until 2100 with colored lines and decadal means (dots). For more details, see referenced publications.
