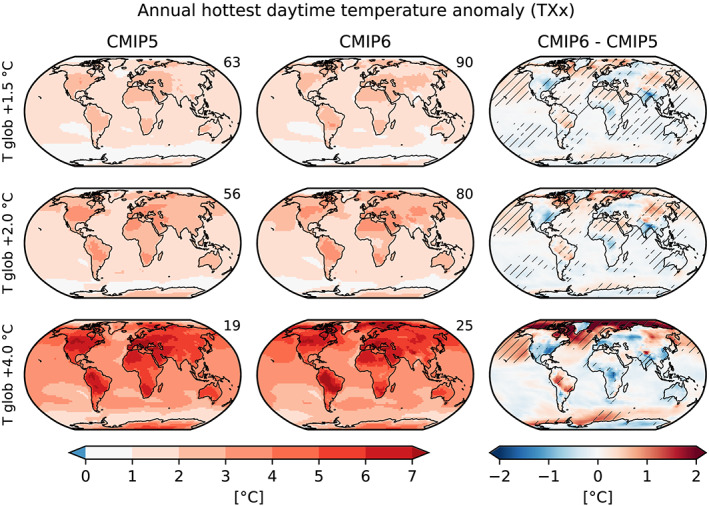
Figure 2.

Anomalies in the annual hottest daytime temperature (TXx) compared with preindustrial (1850–1900) conditions for different global warming levels (rows) in CMIP5 (left column), CMIP6 (center column), and the CMIP6‐CMIP5 differences (right column). Statistically significant differences are hatched. The number in the top right corner of the panels indicate the number of ensemble members used.
