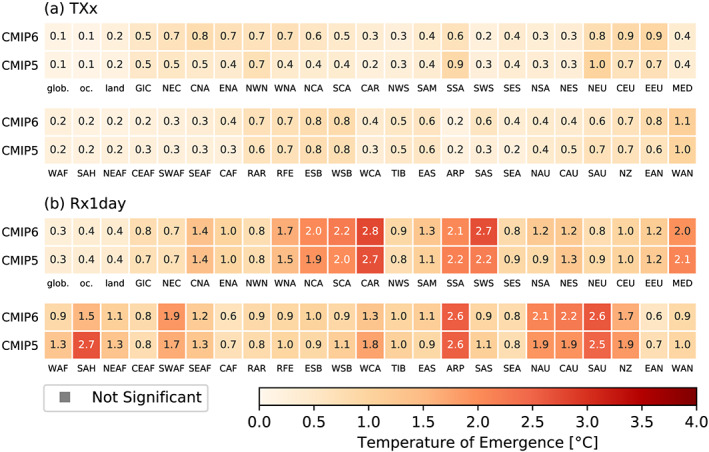
Figure 5.

Global temperature of emergence of signal in regional climate extremes (a) TXx and (b) Rx1day for regions of Figure S1. The colored squares indicate the multimodel mean global warming level at which a difference in response compared with preindustrial conditions (1850–1900, see section 2.4) is statistically significant. Note that the lowest tested warming level is 0.1°C.
