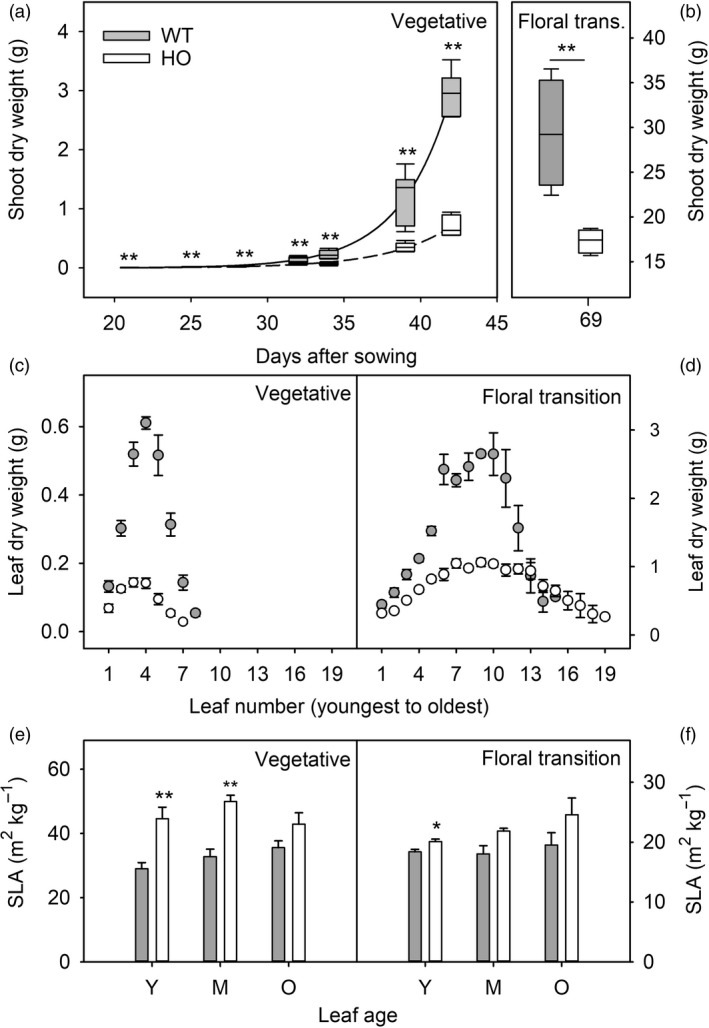
Figure 1.

Growth and biomass allocation of WT (grey) and transgenic HO (white) tobacco plants. Shoot dry weight (leaf and stem mass) is shown for plants harvested from 21 to 42 DAS (vegetative stage: a) and 69 DAS (floral transition stage: b). Individual leaf dry weights (c, d) and specific leaf area (e, f) are shown for plants harvested at either the vegetative (c, e) or floral transition (d, f) stages of growth. Specific leaf area is shown for young/expanding (Y), mature/fully expanded (M) and older (O) leaves. Errors bars represent the standard error of 4–6 plants. Asterisks represent statistically significant differences (*P < 0.05; **P < 0.01) between the two lines according to a t test.
