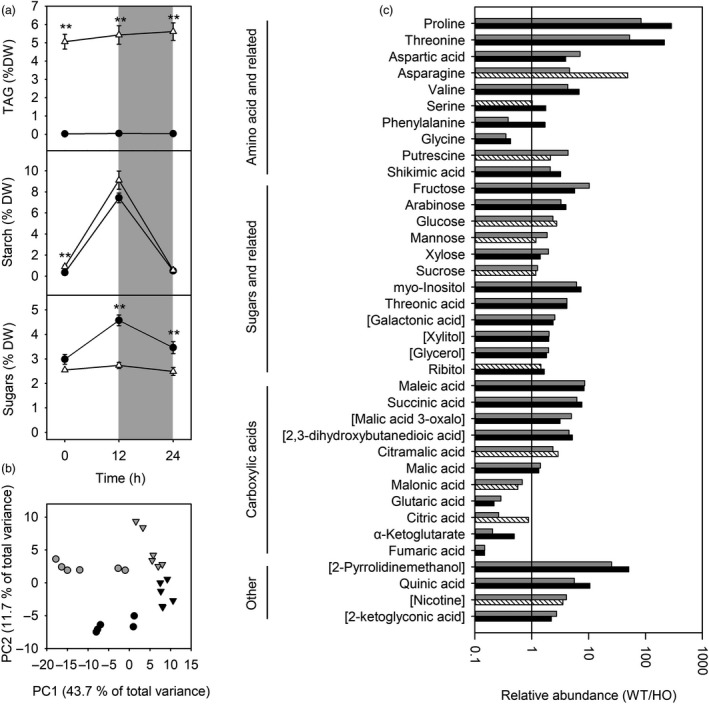
Figure 4.

Carbon partitioning and metabolite accumulation in young/expanding leaves from WT and transgenic HO tobacco during a dark/light cycle. Leaf TAG, starch and sugar content in WT (black circles) and HO (white triangles) tobacco (a). Asterisks represent statistically significant differences (**P < 0.01) between the two lines according to a t test. Principal components analysis (b) of metabolite abundance in WT (circles) and HO (triangles) plants at the end of the day (grey) and the end of the night (black). Relative abundance of metabolites (c) that are differentially accumulated (P < 0.05) at the end of the day (grey) or end of the night (black). Metabolites that are not significantly different between WT and HO are shown using striped bars. Names of metabolites that were only putatively identified are shown in square brackets.
