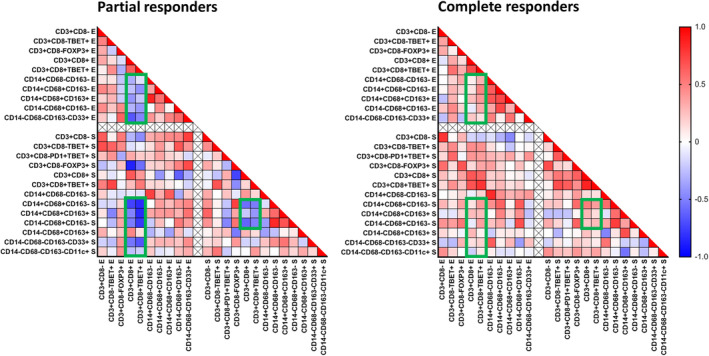
FIGURE 3.

Correlation between the absolute numbers of tissue infiltrating T cells and myeloid cells in the pre‐imiquimod vHSIL biopsies of partial responders and complete responders. Nonparametric Spearman r correlation analysis (two‐tailed) was performed to analyze the co‐infiltration of the indicated different immune cell subtypes in the epithelium (E) and stroma (S), and is shown in a heatmap for vHSIL partial responders and complete responders to topical imiquimod treatment. Red indicates a strong positive correlation between the two cell phenotypes, blue a strong negative correlation, the green squares indicate the most striking differences between the partial and complete responders. A threshold of a median cell count ≥10 cells/mm2 in at least one group (NR, PR, CR or healthy vulva) was applied to study the changes in biologically common phenotypes. CR, complete responders (n = 14); PR, partial responders (n = 12)
