
FIGURE 7.
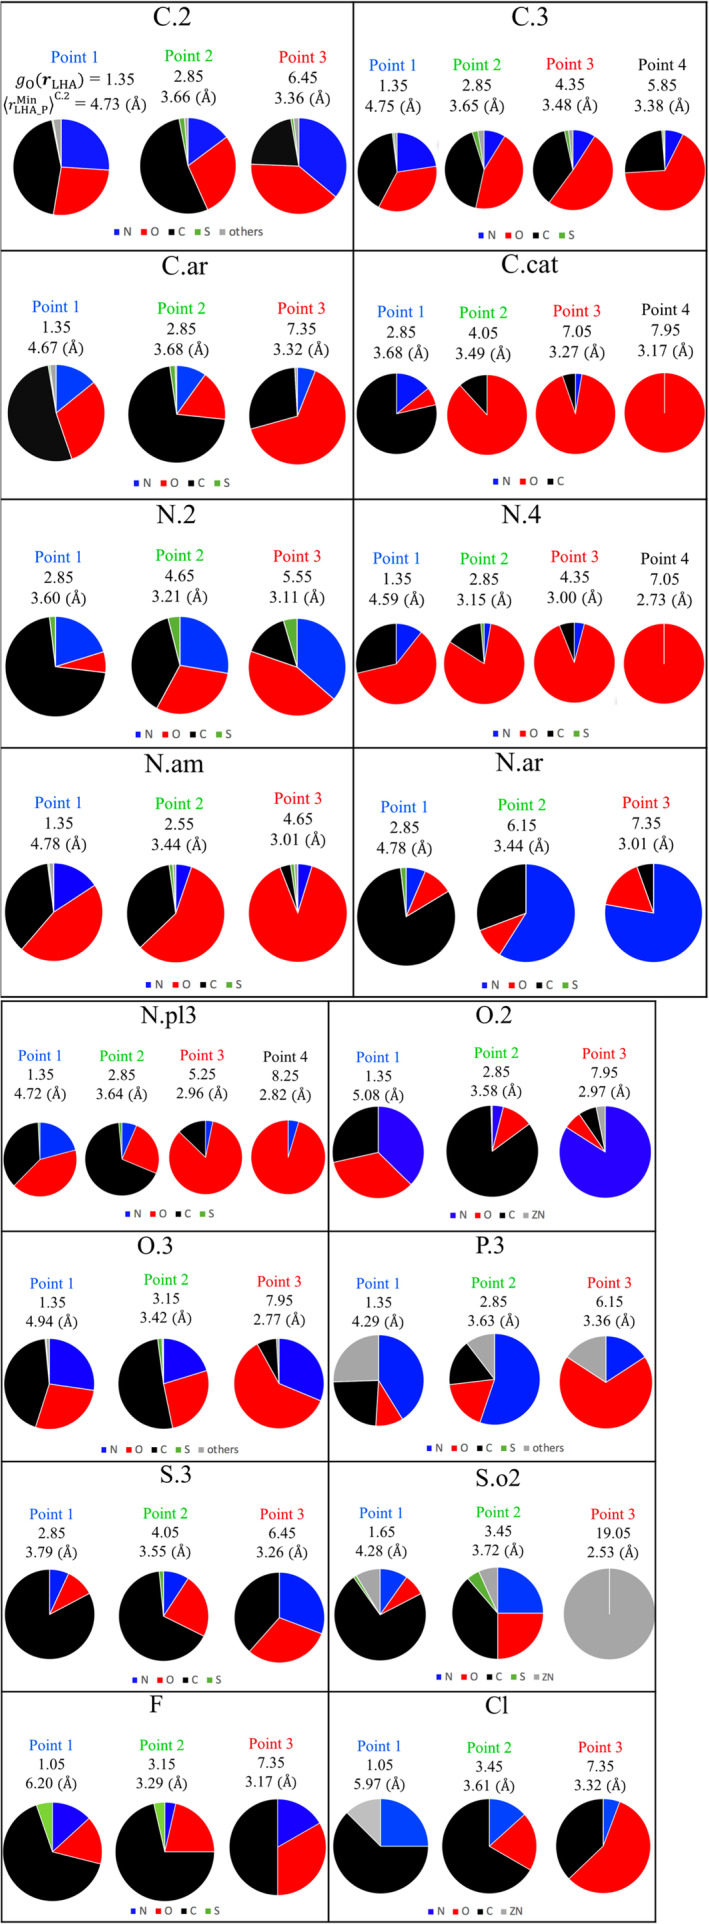
Pie charts for the ligand atom types shown in boldface in Table 1. The point number, gO(rLHA), and are shown in each chart [Color figure can be viewed at wileyonlinelibrary.com]
Official websites use .gov
A
.gov website belongs to an official
government organization in the United States.
Secure .gov websites use HTTPS
A lock (
) or https:// means you've safely
connected to the .gov website. Share sensitive
information only on official, secure websites.
Pie charts for the ligand atom types shown in boldface in Table 1. The point number, gO(rLHA), and are shown in each chart [Color figure can be viewed at wileyonlinelibrary.com]