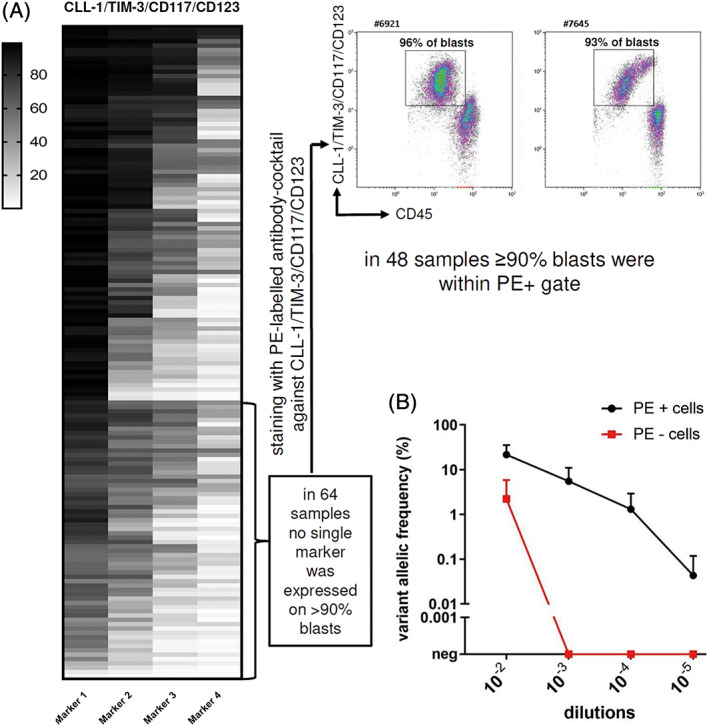
FIGURE 2.

Expression of enrichment markers in 150 AML samples and dilution experiment to determine the sensitivity for detecting a leukemic cell in NBM. A, Expression of enrichment markers in 150 diagnostic AML samples. The makers are arranged in descending order with the marker displaying the highest percentage of cells at the left while the marker displaying the lowest percentage of cells positive is on the right. Each row represents one patient sample. In 64 samples no single marker was expressed on >90% of blasts. Thus, these samples were analyzed with an PE‐labeled antibody cocktail targeting all four enrichment markers. Two representative examples of primary AML samples are shown. In 48 samples the majority of blasts (>90%) were then identified within the PE (marker) positive gate. B, NPM1 variant allelic frequency (VAF) of sorted PE positive (black) and PE negative cells (red) of various dilutions of three NPM1 W288fs*12 mutated leukemic samples mixed with normal BM cells (mean ± SE). neg, negative; NBM, normal bone marrow [Color figure can be viewed at wileyonlinelibrary.com]
