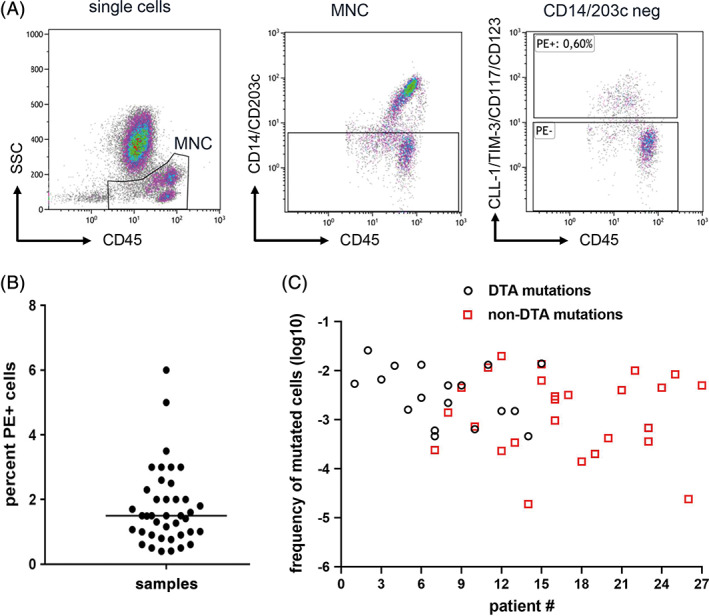
FIGURE 3.

Leukemic cell enrichment using MFC‐based sorting followed by parallel sequencing for MRD detection. A, Sorting strategy for enrichment of residual leukemic cells. The MNCs were identified using SSC low and CD45 low. The monocytes and basophils were excluded using CD14/CD203c. The CD14/CD203c negative cells were gated on marker cocktail and the marker positive and marker negative fractions were sorted. B, Percentage of sorted PE (marker) positive cells calculated as percentage of total nucleated BM cells obtained after FACS based cell sorting in 41 remission samples. C, Calculated frequencies of mutated cells detected during complete remission using our two‐step MRD detection method. Black circles denote mutated cell frequencies as detected by DTA mutations and red squares display mutated cell frequencies as detected by non‐DTA mutations. MFC, multi‐parameter flow cytometry; MRD, measurable residual disease; MNC, mononuclear cells; DTA, DNMT3A, TET2 or ASXL1 [Color figure can be viewed at wileyonlinelibrary.com]
