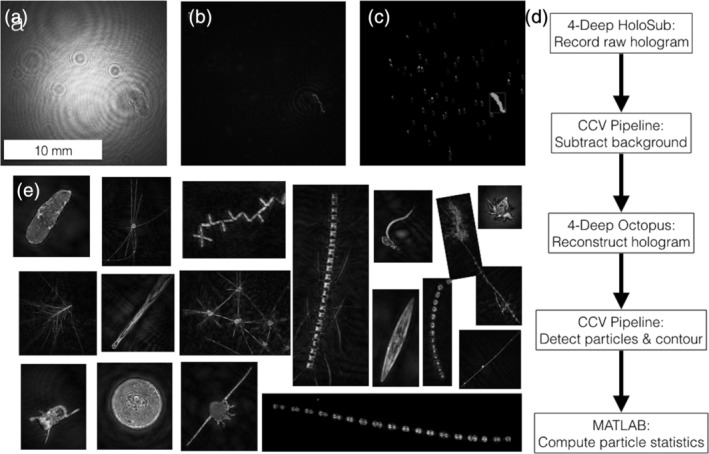
Fig 2.

The custom hologram processing pipeline extracts 2D contours from the image volume. (a) A raw 2D hologram. (b) A refocused hologram image at 16,250 μm from the laser source, revealing chain‐forming diatoms. (c) Regions of interest (colored and sorted) derived from the image processing pipeline. (d) A flowchart of the hologram processing pipeline illustrates the role of each constituent software package, from raw hologram to quantitative particle statistics. The 4‐Deep HoloSea and Octopus software record the raw holograms. The CCV Pipeline computes and subtracts the image background, which is calculated as a composite of median pixel intensities for three images before and after the image of interest. This step is critical for field deployments in which small contaminants frequently adhere to optical surfaces and lead to repeated construction of particles stuck to the instrument. The 4‐Deep Octopus software reconstructs background‐subtracted holograms. The CCV Pipeline detects and contours particles. MATLAB code refines data quality and computes particle statistics. (e) An assortment of re‐focused hologram contours illustrate a variety of large marine “particles” (phytoplankton, zooplankton, pellets and detritus) with sizes ranging from 10 to 200 μm ESD.
