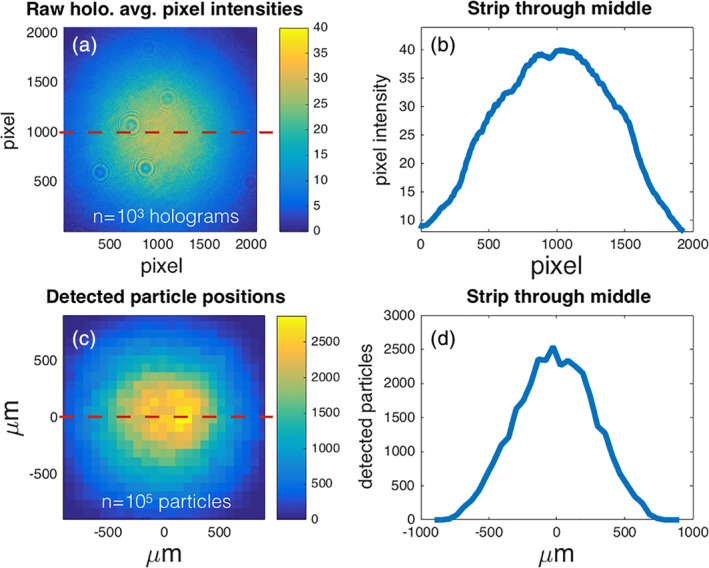
Fig 3.

The probability distribution of detected particles in the imaging volume varies horizontally, vertically, and with depth. The frequency of detected particles collapsed onto a single depth plane shows that the greatest number of detected particles occurs at the center of the imaging volume (c). A similar distribution in the raw hologram pixel intensity (a) suggests that the detection of objects is dependent on the nonuniform intensity of the illumination source. A single slice through the detected particle distribution (red dashed line) shows Gaussian distribution (d). Qualitative similarity between a slice in the mean hologram intensities (red dashed line) suggests that the observation probability of uniformly distributed objects is a function of laser intensity.
