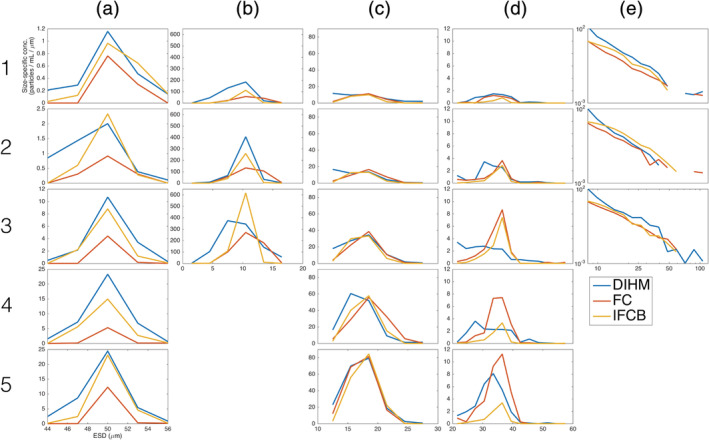
Fig 4.

The particle size distribution intercomparison results for the DIHM, FC, and IFCB show good agreement after artifact‐filtering. Results are shown for 50 μm microspheres (a), Dunaliella tertiolecta (b), Heterosigma akashiwo (c), Prorocentrum micans (d), and environmental samples (e) for the DIHM (blue line), Imaging FlowCytobot (red line), and FlowCam (yellow line). Sample numbers increase in concentration 1 (lowest) to 5 (highest) for microsphere and monoculture samples, and Niskin bottle, that is, environmental sample collection depth. Note that the y‐axis limit is fixed for the Dunaliella tertiolecta, Heterosigma akashiwo, Prorocentrum micans, and environmental sample concentrations, but the y‐axis limit is not fixed for the beads in order to highlight greater detail for the calibration PSD.
