
Fig 6.
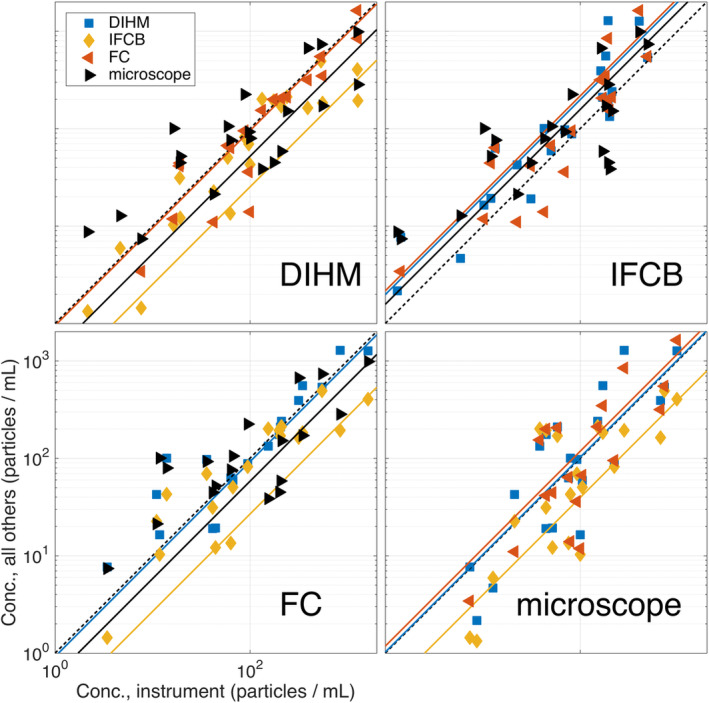
On the x‐axis for each of these panels is the concentration measured by (a) DIHM, (b) IFCB, (c) FC, and (d) manual microscope. On the y‐axis is the concentration measured by each of the other instruments. This figure illustrates the scatter and trend of one instrument relative to another instrument. A linear regression, forced through the intercept (in log–log space) for each series was plotted as a dashed line. The form of these linear regression equations are given as Concinst.B = Concinst.A × 10m. The slope m and the r 2 values are given in the Supplementary Information. A 1 : 1 relationship indicates a match between the concentration observed between the instrument and the mean of all instruments.