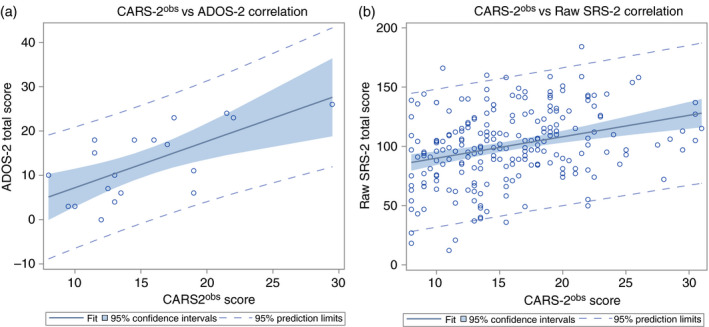
Figure 2.

(a) Regression plot of the Childhood Autism Rating Scale, Second Edition based on patient observation (CARS‐2obs) and Autism Diagnostic Observation Schedule, Second Edition (ADOS‐2) for all patients. (b) Regression plot of the CARS‐2obs and raw Social Responsiveness Scale, Second Edition (SRS‐2) total scores for all patients. The line of best fit is noted along with the 95% confidence intervals and 95% prediction limits. Although there is evidence of overestimation for a CARS‐2obs greater than 25, suggesting that the relationship may not be uniformly linear, removal of this group of individuals did not significantly affect the model.
