FIGURE 3.

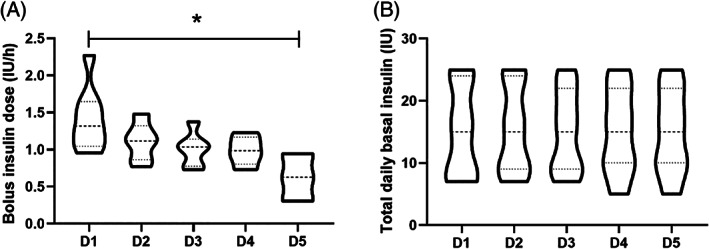
Comparison of (A) bolus and (B) basal insulin doses over the course of the 5 days. Values are given as violin plots. *indicates statistical significance. D, day

Comparison of (A) bolus and (B) basal insulin doses over the course of the 5 days. Values are given as violin plots. *indicates statistical significance. D, day