Abstract
Pancreatic cancer is one of the most lethal cancers and its prognosis remains poor. ADAM family proteins like ADAM10, ADAM9 and ADAM17 function as α-secretase to cleavage cell surface proteins like Notch to facilitate oncogenesis in various tumors. The oncogenic roles of α-secretase in PDAC have been demonstrated but it remains unknown that whether and how α-secretase is regulated in PDAC. Here, we report that the expression of tetraspanin CD9 was increased and strongly associated with poor prognosis in PDAC. CD9 expression was positively associated with α-secretase activity in PDAC tissues and CD9 knock-down inhibited α-secretase activity in PDAC cell lines. Co-immunoprecipitation and GST pull down demonstrates that CD9 directly interacted with ADAM10, ADAM9 and ADAM17, respectively. Cell surface biotin labeling and immunostaining of tagged ADAM proteins show that CD9 promoted cell surface trafficking of ADAM family proteins. In addition, the antibody targeting extracellular domain of CD9 disrupted the interactions between CD9 and ADAM family proteins, reduced cell surface trafficking of ADAM proteins and inhibited α-secretase activity. Notch signaling was inhibited by CD9 knockdown or CD9 antibody in cell lines. Finally, CD9 antibody showed anti-tumor effects in cell proliferation MTT assay, transwell migration assay and colony formation assay. Our study reveals a novel CD9/ADAM/Notch signaling network in PDAC and it supports that targeting CD9-ADAM interaction with antibody may be a potential therapeutic intervention for PDAC.
Keywords: Pancreatic cancer, α-secretase, CD9, ADAM10, ADAM9, ADAM17, Notch
Introduction
Pancreatic cancer is one of the most lethal cancers in the world. Although considerable efforts have been made to investigate the pathogenesis of pancreatic cancer, the 5-year survival rate of pancreatic ductal adenocarcinoma (PDAC) is only around 5% [1]. Recent advance in deep sequencing has revealed the complex genetic landscape of PDAC and activation mutations of KRAS represent one of the most common genetic alterations in PDAC [2,3]. However, nearly all efforts to target KRAS end up with failures in clinical trials [4]. Thus, it’s imperative to explore novel targets in PDAC.
Alpha-secretase is the proteolytic enzyme that cleaves amyloid precursor protein (APP) [5]. Several members of the ADAM (a disintegrin and metalloprotease domain) family, such as ADAM10 [6], ADAM9 [7] and ADAM17 [8], have been identified as α-secretase. ADAM family members are cell surface proteins with adhesion and protease domains and they act to cleave a wide range of cell surface proteins [9]. For instance, ADAM10 is the most important enzyme with α-secretase activity and it sheds various proteins like APP, Neuroligin-1 and NCAM in the brain. The essential role of α-secretase in Alzheimer’s disease is well established and the important contribution of α-secretase in various tumors has also begun to emerge [10]. In tumors, ADAM10 sheds diverse ligands and receptors of Notch, Eph and erbB families to activate oncogenic signaling pathways. Interestingly, several independent studies show that ADAM10 [11-13], ADAM9 [14] or ADAM17 [15] could promote the aggression of PDAC. Thus, α-secretase might be a promising target for the treatment of PDAC.
However, whether and how α-secretase is regulated in PDAC is poorly understood. Previous studies show that tetraspanins could regulate cellular trafficking and activity of ADAM10 [16-18] and ADAM17 [19]. Tetraspanins are integral membrane proteins involved in a variety of physiological and pathological processes [20]. But none of those studies were performed in PDAC. In the current study, we show that tetraspanin CD9 is up-regulated and associated with poor prognosis in PDAC. CD9 directly interacts with ADAM10, ADAM9 and ADAM17 to promote their cellular trafficking, enhance their α-secretase activities and activate Notch signaling in PDAC. The antibody targeting extracellular domain of CD9 could disrupt the interaction between CD9 and ADAM family members and showed anti-tumor effects in in-vitro assays. Our study supports that CD9-ADAM interaction plays an important role in PDAC and targeting this interaction with antibody may be a potential therapeutic for PDAC treatment.
Material and methods
Clinical samples
Fresh PDAC tumor and matched normal specimens from 30 patients who were diagnosed and underwent surgery in Xinhua Hospital between 2015 and 2018 were included in this study. None of the patients received chemotherapy or radiation therapy before surgery. The study was approved by the Institutional Review Boards of Xinhua Hospital and written informed consent was obtained from each subject.
Cell lines
Capan-2 (HTB-80) and PANC-1 (CRL-1469) cell lines from ATCC were maintained in McCoy’s 5a Medium and DMEM with 10% fetal bovine serum (FBS), 100 U/ml penicillin and 100 mg/ml streptomycin, respectively. Cells were cultured in a humidified atmosphere with 5% CO2 at 37°C.
RNA extraction and TaqMan real-time PCR assay
For cell lines and tissue samples, total RNA was extracted using Trizol reagent according to the manufacturer’s instructions. Following TaqMan assays were used for target gene quantification: CD9 (Hs01124022_m1), HES-2 (Hs01021800_g1), c-MYC (Hs01021800_g1), cyclin D3 (Hs05046059_s1) and actin (Hs01060665_g1). The relative expression level for each gene was calculated using the 2-ΔΔCt method.
Western blot
Proteins were extracted from cell lines or tissues using RIPA buffer (150 mM NaCl, 0.1% Triton X-100, 0.5% sodium deoxycholate, 0.1% SDS, 50 mM Tris-HCl, pH 8.0). Protein samples were resolved by SDS-PAGE and analyzed by western blot with following antibodies: CD9 (Santa Cruz, sc-51575), ADAM10 (abcam, ab124695), ADAM9 (abcam, ab218242), ADAM17 (abcam, ab13535), GST (abcam, ab111947), Cleaved Notch1 (CST, 4147), c-Myc (CST, 5605), HES1 (CST, 11988), Cyclin D3 (CST, 2936) and His (CST, 12698).
Co-immunoprecipitation
Cells were lysed in RIPA lysis buffer with complete protease inhibitor cocktail and lysates were centrifuged at 15000 g for 20 min at 4°C. The supernatant was incubated indicated antibodies at 4°C overnight. Then, the protein complexes were collected by incubation with Protein A/G beads and washed with RIPA buffer for 5 times and eluted by SDS loading buffer.
Recombinant GST-CD9 protein purification and GST pull-down assay
The coding sequence of CD9 with stop codon was cloned into the SpeI and XhoI sites of PET-42a (+) vector and the expression of GST-tagged CD9 fusion protein was induced with 1 mM IPTG for 12 h at 37°C in BL21 Escherichia coli (Novagen). The bacteria were collected by centrifugation and purified by BugBuster® GST•Bind™ Purification Kit and reconstituted in TBS. The purity of GST-CD9 fusion proteins was analyzed by Pierce Silver Stain Kit (24612). In GST pull-down assay, the purified GST-CD9 recombinant protein (1 ug) was incubated with 1 ug of His tagged extracellular domains of ADAM10 (Thr214-Glu672, 936-AD-020, novus), ADAM9 (Ala206-Asp697, 939-AD-020, novus) or ADAM17 (Arg215-Asn671, 930-ADB-010, rndsystems), or GST protein (abcam, ab70456) at 37°C for 2 hours. GST Pull-down was performed using Pierce™ GST Protein Interaction Pull-Down Kit (21516) according to the manufacturer’s instruction. The samples were analyzed by western blot.
Constructs of knock-down and over-expression
For over-expression constructs, the coding sequence of human CD9 (NM_001769.4) with N-terminal Myc tag was cloned into pcDNA 3.1 vector. The coding sequence of human ADAM10 (NM_001110.4), ADAM9 (NM_003816.3) or ADAM17 (NM_003183.6) with N-terminal FLAG tag was cloned into pcDNA 3.1 vector, respectively. For CD9 knock-down, two short hairpin RNAs (shRNAs) targeting different sites of human CD9 mRNA sequence were designed as follows: shRNA-1 forward TG CCATTGGACTATGGCTCCGATTCGATTCAAGAGA TCGAATCGGAGCCATAGTCCAATGGCTTTTTTC; shRNA-1 reverse: TCGAGAAAAAAG CCATTGGACTATGGCTCCGATTCGATCTCTTGAATCGAATCGGAGCCATAGTCCAATGGCA; shRNA-2 forward: TG GGCATTGCCGTGGTCATGATATTTGTTC AAGAGA CAAATATCATGACCACGGCAATGCCCTTTTTTC; shRNA-2 reverse: TCGAGAAAAAAG GGCATTGCCGTGGTCATGATATTTGTCTCTTGAA CAAATATCATGACCACGGCAATGCCCA). They were constructed into the pLentiLox3.7 (pLL3.7) lentiviral vector. Target sequence was underlined. The lentivirus was packaged and amplified in HEK293T cells. Cell lines were infected at an MOI of 5.
Cell surface biotin labeling
Cell surface labeling was performed with Pierce™ Cell Surface Biotinylation and Isolation Kit (A44390). In brief, cells are first labeled with EZ-Link Sulfo-NHS-SS-Biotin, a thiol-cleavable amine-reactive biotinylation reagent. Cells are subsequently lysed and the labeled proteins are captured with NeutrAvidin Agarose. Dithiothreitol (DTT) is used in the elution to reduce the disulfide bonds in the biotin label, resulting in the release of the bound proteins without the biotin label. The biotinylated proteins were further analyzed by western blot.
In-vitro FRET assay for α-secretase
The α-secretase activity was measured in 100 mM sodium acetate (pH 7.0) with 2 mg fluorogenic substrate (Calbiochem, 565767). Once substrate is cleaved by α-secretase, the energy transfer is disturbed and fluorescent signal is enhanced. Cells were homogenized and centrifuged. Secretase in the membrane pellet were re-solublized and 20 ug fraction was used to incubate fluorogenic substrate in each reaction. After incubation at 37°C for 4 h, the fluorescence intensities were measured with an excitation wavelength at 340 nm and an emission wavelength at 490 nm.
Immunofluorescence and immunochemistry
Immunochemistry analysis was performed in sections of paraffin-embedded tissues (6 um thickness). Staining with CD9 antibody (1:200 dilution) was performed using VectaStain Universal ABC kit and slides were counter-stained with hematoxylin. For cell surface trafficking of ADAM proteins, cells were transfected with FLAG-tagged ADAM10, ADAM9 or ADAM17 together with pcDNA3.1-CD9 or pcDNA3.1 vector using lipofectamine 2000. Two days after transfection, cells were washed with PBS and fixed in 4% paraformaldehyde. Cells were blocked in 5% goat serum in PBS at room temperature for 60 min without permeabilization. Cells were stained with FLAG antibody (1:2000 dilution in PBS) overnight at 4°C. Then, cells were washed with PBS and incubated with fluorescent dye-labeled secondary antibody at room temperature for 60 min. Finally, cells were washed with PBS and mounted in DAPI containing medium.
Luciferase assay of Notch activity
PDAC cell lines were transfected with CSL (CBF1/RBP-Jk) luciferase reporter vector, which is a Notch pathway-responsive reporter and contains the firefly luciferase gene under the control of multimerized CSL responsive elements. After 48 h, reporter gene activity was measured by the dual-luciferase assay-system (Promega). Renilla luciferase vector was used to normalize for transfection efficiency. The data were presented as fold change relative to the control group.
Cell proliferation assay
Cells proliferation was measured by MTT Cell Proliferation Assay Kit (abcam, ab211091). In brief, cells were plated in 96-well plate1 at 1×10⁶ cells per mL). At indicated time points, culture medium was replaced by 50 µL of serum-free media and 50 µL of MTT Reagent in each well. Incubate the plate at 37°C for 3 hours and add 150 µL of MTT Solvent into each well. Wrap the plate in foil and shake on an orbital shaker for 15 minutes and read absorbance at OD=590 nm.
Colony formation assay
Cells were seeded into 6-well plates and incubate the cells in CO2 incubator at 37°C for 2 weeks. Culture medium was removed. Cells were washed with PBS and fixed at room temperature for 10 min. Remove fixation solution. Add 0.5% crystal violet solution and incubate at RT for 30 min. Crystal violet wash removed and washed by tap water. Air-dry the plates on a table cloth.
In-vitro cell migration assay
Cells were trypsinized and resuspend into single cell solution. In the 24-well transwell plate with 8-μm pore size insert, 2.6 ml of medium with 10% FBS was added into the lower compartment and single cell solution (1×10⁵ cells) was added into the upper compartment. Incubate the cells in the transwell plate at 37°C and 5% CO2 for 6 h. Take the insert out and cells remain on the upper side of the filter membrane were removed with a cotton swab. Fix and stain cells on the lower side of the insert filter with 1% crystal violet in 2% ethanol for 20 min. Remove excess crystal violet by quickly merging the insert in ddH2O for 3 to 4 sec. Dry the insert membrane and count the number of cells on the lower side of the filter under a microscope.
Statistical analysis
Statistical analysis was performed by SPSS 16.0 software (SPSS Inc., Chicago, IL, USA). Two-tailed Student’s t test was used to compare mean values. Pearson correlation coefficient was used for correlation analysis. The survival curves were estimated by Kaplan-Meier analysis, and P values were calculated by log rank test. Statistically significant differences were defined as P<0.05. For all, *P<0.05, **P<0.01, ***P<0.001.
Results
CD9 expression in PDAC tissues
To evaluate CD9 expression in PDAC tissues, western blot, immunochemistry and TaqMan qPCR assay were performed in tumor tissues (n=30) and paired normal tissues (n=30) from 30 cases of PDAC. Western blot (Figure 1A) showed that the CD9 protein levels were enhanced in tumor tissues compared to control tissues. This was confirmed by immunochemistry analysis in the same set of samples. CD9 staining showed a strong membrane signal in PDAC tumor tissues but only weak staining was observed in control tissues (Figure 1B). Consistently, TaqMan qPCR results showed CD9 mRNA expression in PDAC tumors was also enhanced (Figure 1C). The enhancement of CD9 expression in PDAC tumors was further cross-validated with expression data from TCGA PAAD dataset (Figure 1D). In addition, Kaplan-Meier analysis showed that CD9 up-regulation was strongly associated with short survival in TCGA PAAD dataset (HR=2.3, P=0.00012, Figure 1E). Taken together, these data suggest that CD9 expression was enhanced in PDAC tumors and CD9 may promote aggression of PDAC.
Figure 1.
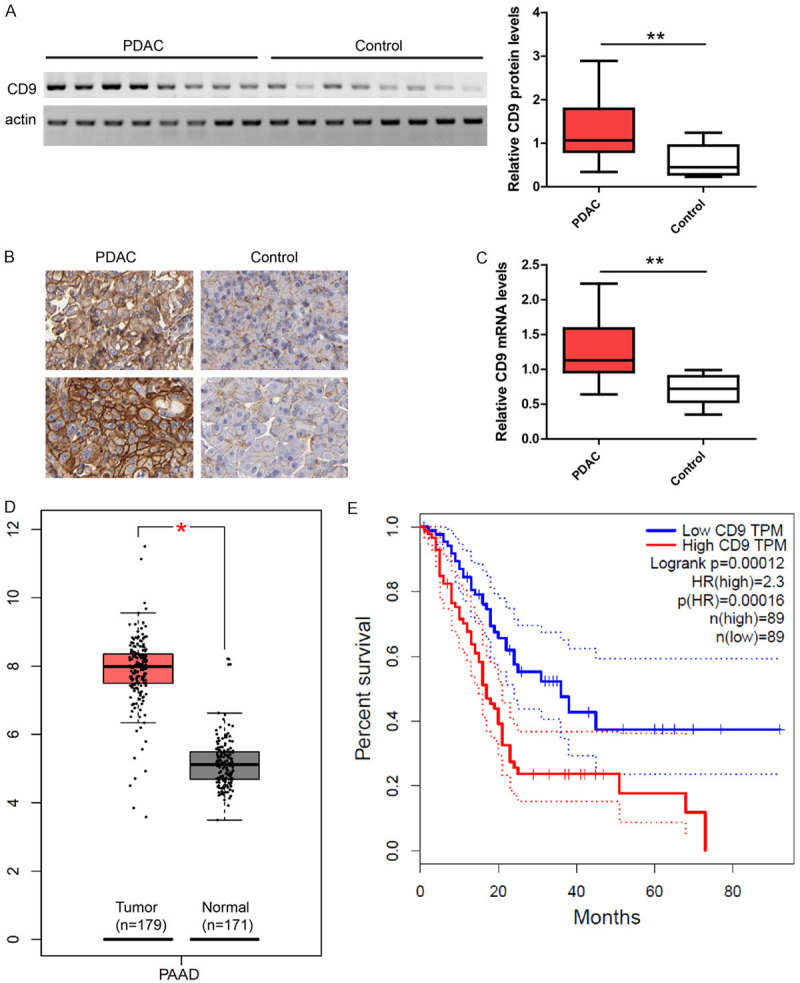
CD9 expression in pancreatic cancer. A. Representative images and quantification of western blot showing CD9 protein levels were increased in PDAC tumors (n=30) compared to paired control tissues (n=30). Data were presented as whiskers-box plots. B. Representative images of immunochemistry in sections showing higher CD9 staining in PDAC compared to control tissues. C. TaqMan qPCR results showing CD9 mRNA levels were increased in PDAC tumors (n=30) compared to paired control tissues (n=30). D. Expression data of TCGA-PAAD dataset showing up-regulation of CD9 in PDAC tumors. E. Kaplan-Meier analysis of survival curves in TCGA-PAAD dataset showing high CD9 expression was associated with short survival. For all, *P<0.05, **P<0.01.
The expression and activity of α-secretase in PDAC tissues
The enhanced expression of several ADAM family members including ADAM10, ADAM9 and ADAM17 in PDAC were previously reported. Consistently, an exploration of TCGA PAAD dataset showed robust enhancement of ADAM10, ADAM9 and ADAM17 expression (Figure 2A). However, it’s unclear whether and how the α-secretase activity is abnormal in PDAC tumors. To measure α-secretase activity, an in-vitro FRET assay was performed with our PDAC tumor (n=30) and control (n=30) tissues. The results showed that α-secretase activity was greatly enhanced in PDAC tumors (Figure 2B). In addition, there was a positive association between CD9 protein level and α-secretase activity in PDAC tumors (Pearson r=0.5797, P=0.0008, Figure 2C). It suggests that CD9 may regulate α-secretase activity of ADAM family members like ADAM10, ADAM9 and ADAM17 in PDAC.
Figure 2.
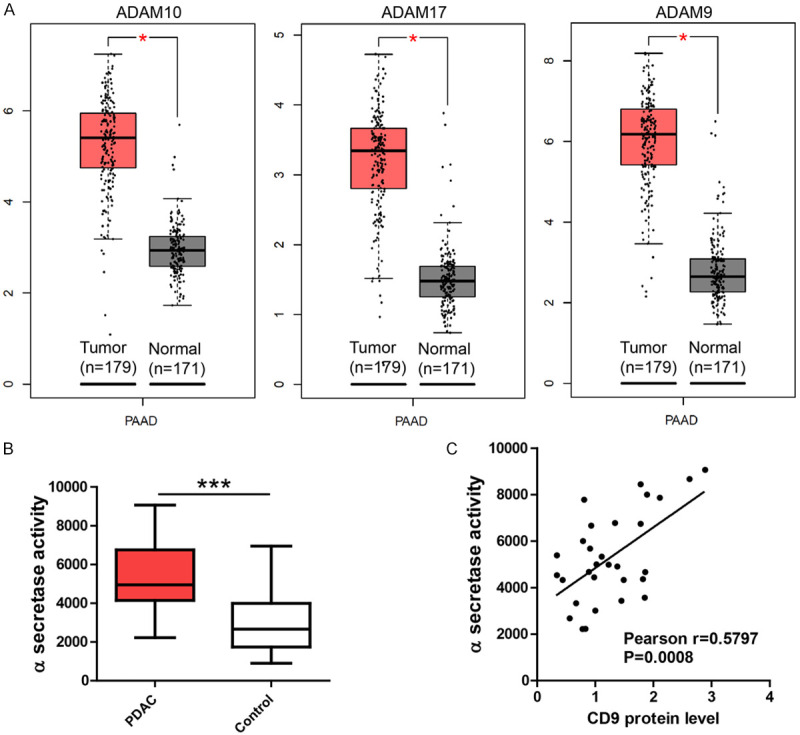
α-secretase activity in pancreatic cancer. A. Expression data of TCGA-PAAD dataset showing the up-regulation of ADAM10, ADAM9 and ADAM17 in PDAC tumors. B. In-vitro FRET assay showing α-secretase activity was enhanced in PDAC tumors (n=30) compared to paired control tissues (n=30). C. Scatter plot showing the positive association between CD9 protein level and α-secretase activity (Pearson r=0.5797, P=0.0008) in PDAC tissues. For all, *P<0.05, ***P<0.001.
CD9 regulates cell surface trafficking and α-secretase activity of ADAM family in PDAC
To further investigate the potential effects of CD9 on α-secretase, we performed knock-down of endogenous CD9 with two different lenti-viral shRNAs in two PDAC cell lines and α-secretase activity was measured by FRET assay. Western blot validated the efficiency of CD9 known-down in PDAC cell lines (Figure 3A). FRET assay showed that CD9 knock-down inhibited α-secretase activity in PDAC cell lines (Figure 3B). These data further support that CD9 regulates the α-secretase activity of ADAM family in PDAC.
Figure 3.
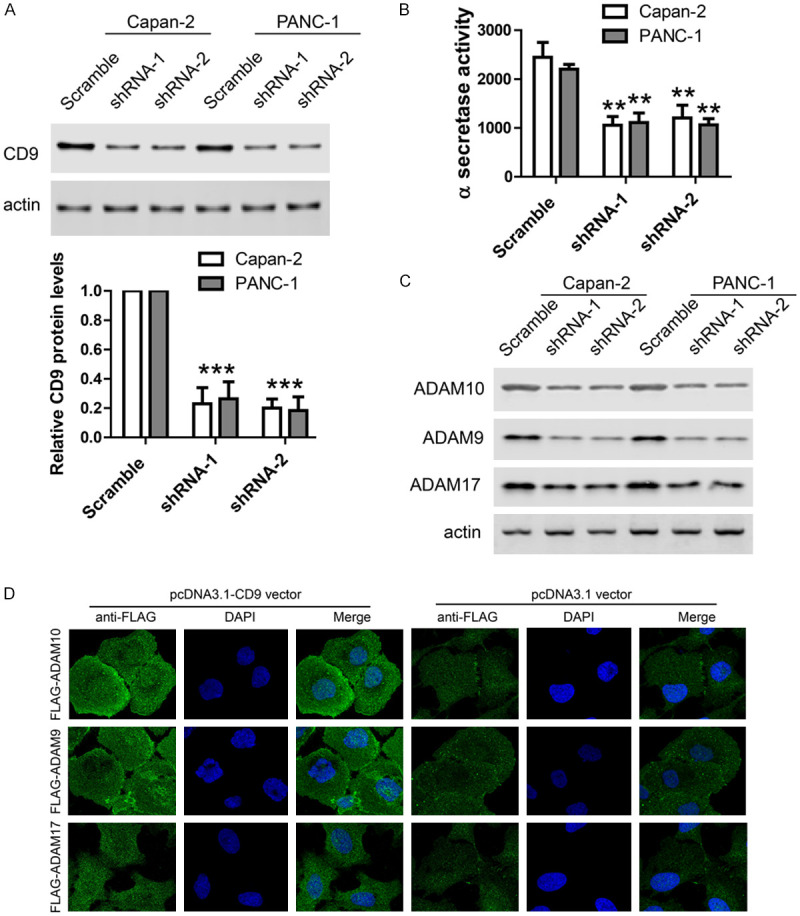
CD9 regulates cell surface trafficking and α-secretase activity of ADAM family in PDAC. A. Representative images and quantification of western blot showing CD9 protein levels after its lenti-viral knockdown in two PDAC cell lines. B. In-vitro FRET assay showing α-secretase activity was inhibited by CD9 knockdown in two cell lines. C. Cell surface biotin labeling results showing the protein levels of ADAM10, ADAM9 and ADAM17 on the cell surface were reduced by CD9 knockdown. D. Immunofluorescence images of FLAG antibody staining in non-permeabilized cells transfected with FLAG-ADAM10, FLAG-ADAM9 or FLAG-ADAM17 together with pcDNA3.1-CD9 or control vector. For all, **P<0.01, ***P<0.001.
As previous studies report that CD9 regulates the α-secretase activity of ADAM family by modulating their cell surface trafficking, we investigated the potential effects of CD9 on the cell surface trafficking of ADAM10, ADAM9 and ADAM17 in PDAC cells. Cell surface biotin labeling was performed in PDAC cells infected with CD9 shRNAs and protein levels of ADAM10, ADAM9 and ADAM17 on the cell surface were measured by western blot. The result showed that the cell surface levels of these ADAM family members were greatly reduced after CD9 knock-down (Figure 3C). To further confirm that CD9 could regulate cell surface trafficking of ADAM proteins, we performed immunostaining in non-permeabilized cells transfected with N-terminal FLAG tagged ADAM gene constructs to monitor their surface trafficking. In PDAC cells transfected with FLAG-ADAM10, FLAG-ADAM9 or FLAG-ADAM17, these was only weak localization on cell surface. However, co-transfection of CD9 greatly enhanced cell surface trafficking of these ADAM proteins in PDAC cells (Figure 3D). Taken together, these results support that CD9 promoted cell surface trafficking of ADAM proteins to enhance α-secretase activity in PDAC cells.
CD9 directly interacts with ADAM family members in PDAC
Previous studies have shown that CD9 interacts with ADAM proteins to regulate their cellular trafficking. Thus, it’s likely that CD9 also interacts with ADAM proteins in PDAC. To detect the interaction between CD9 and ADAM proteins, lysates of PANC-1 cell were precipitated with indicated ADAM antibodies and blotted with CD9 antibody. The results show that CD9 was co-precipitated with ADAM10, ADAM9 and ADAM17 in PDAC cell line (Figure 4A).
Figure 4.
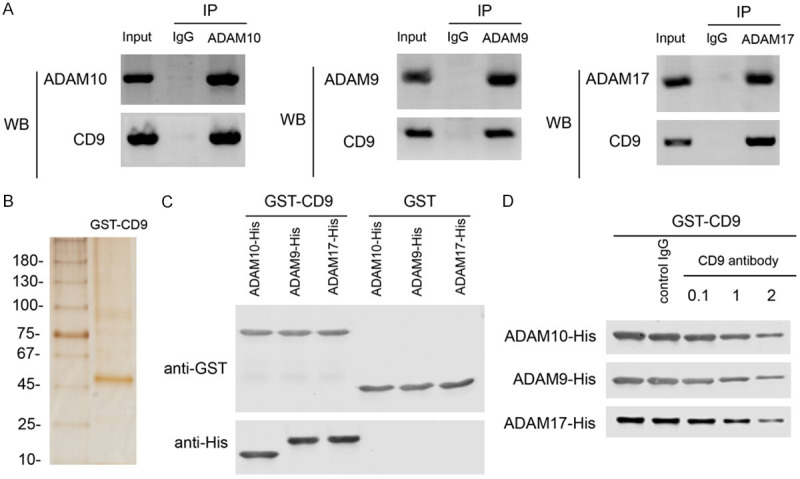
CD9 directly interacts with ADAM family members in PDAC. A. Co-IP results showing CD9 protein levels precipitated by ADAM10, ADAM9 or ADAM17 antibody in PANC-1 cell line. B. Silver staining of purified recombinant GST-CD9 protein. C. GST pull-down showing the interaction of GST-CD9 with His tagged extracellular domains of ADAM10 (Thr214-Glu672), ADAM9 (Ala206-Asp697) or ADAM17 (Arg215-Asn671), respectively. D. GST pull-down showing that CD9 antibody blocked the interaction of GST-CD9 with His tagged extracellular domains of ADAM10, ADAM9 or ADAM17, respectively.
To demonstrate that CD9 could directly interact with ADAM proteins, we purified recombinant CD9 with GST tag and its purity was confirmed by silver staining (Figure 4B). GST pull-down was performed with recombinant GST-CD9 and His tagged extracellular domains of ADAM10 (Thr214-Glu672), ADAM9 (Ala206-Asp697) or ADAM17 (Arg215-Asn671), respectively. After incubation, GST-CD9 was precipitated with GST antibody and ADAM proteins were probed with His antibody. The results showed that GST-CD9 could pull-down all these ADAM proteins. In contrast, GST tag itself could not pull down any ADAM proteins (Figure 4C). To investigate whether the antibody targeting extracellular domain of CD9 could disrupt interactions between CD9 and ADAM proteins, GST-CD9 was incubated with His tagged extracellular domains of ADAM proteins in the presence of CD9 antibody (0.1, 1 or 2 ug) or control IgG (2 ug). The results showed that CD9 antibody could dose-dependently block the interactions between CD9 and ADAM proteins (Figure 4D).
CD9 activates Notch signaling in PDAC
As α-secretase mediated cleavage of Notch is required for the activation of downstream Notch signaling, we hypothesized that CD9 may activate Notch signaling via enhancing the function of ADAM proteins. Thus, we used a luciferase-based assay to monitor Notch activity in PDAC cell lines. Once Notch is first cleaved by α-secretase and then by γ-secretase, the intracellular domain of Notch (NICD) would translocate into nucleus to activate luciferase expression. The results showed that CD9 knock-down greatly reduced Notch activity (Figure 5A). In addition, cleaved Notch1 was detected in PDAC cell lines by western blot and the results showed that cleaved Notch1 was reduced greatly by CD9 knock-down (Figure 5B). The expression of several well-established Notch target genes like HES-2, c-MYC and cyclin D3 was measured by real time-PCR and western blot. The results showed that CD9 knock-down reduced the protein (Figure 5C) and mRNA (Figure 5D) levels of HES-2, c-MYC and cyclin D3 in PDAC cell lines. Taken together, these results support that CD9 activated Notch signaling in PDAC.
Figure 5.
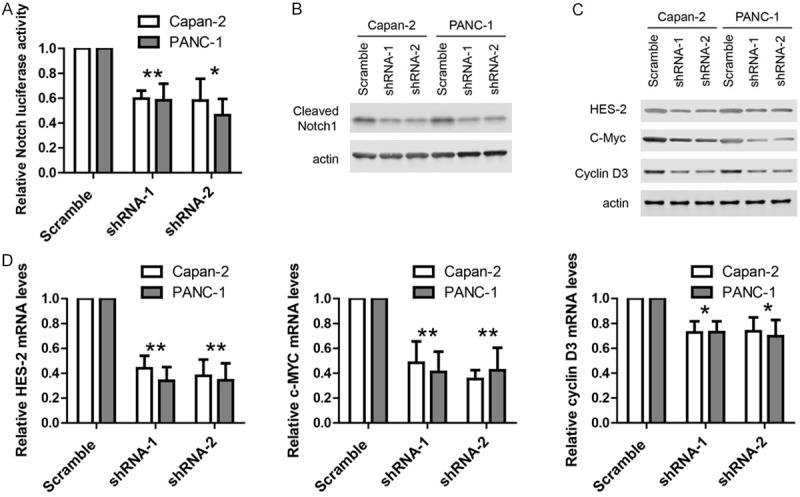
CD9 activates Notch signaling in PDAC. A. Luciferase assay showing Notch activity was inhibited by CD9 knockdown in two cell lines. B. Western blots showing the protein levels of cleaved Notch was reduced by CD9 knockdown in two cell lines. C. Western blots showing the protein levels of HES-2, c-Myc and cyclin D3 were reduced by CD9 knockdown in two cell lines. D. TaqMan qPCR results showing the mRNA levels of HES-2, c-Myc and cyclin D3 were reduced by CD9 knockdown in two cell lines. For all, *P<0.05, **P<0.01.
CD9 antibody inhibits α-secretase activity and modulates behaviors of PDAC cell lines
As the CD9-ADAM interaction is accessible on the cell surface, it’s likely that antibody targeting extracellular domain of CD9 may disrupt cell surface trafficking of ADAM proteins, inhibit their α-secretase activity and suppress downstream Notch signaling. To demonstrate this hypothesis, we added CD9 antibody into the culture medium of PANC-1 cell and incubated for 2 hours. Then, cell surface labeling assay was performed and the cell surface levels of ADAM family members were analyzed by western blot. The results showed that CD9 antibody reduced ADAM proteins on the cell surface (Figure 6A). At the same time, FRET assay showed that α-secretase activity in PDAC cells incubated with CD9 antibody (0.5, 1, 2 ug per well in 12-well plate) was potently inhibited (Figure 6B). In addition, CD9 antibody inhibited Notch activity in luciferase assay (Figure 6C) and reduced the levels of cleaved Notch1 and Notch target genes (HES-2, c-MYC and cyclin D3) in western blot (Figure 6D).
Figure 6.
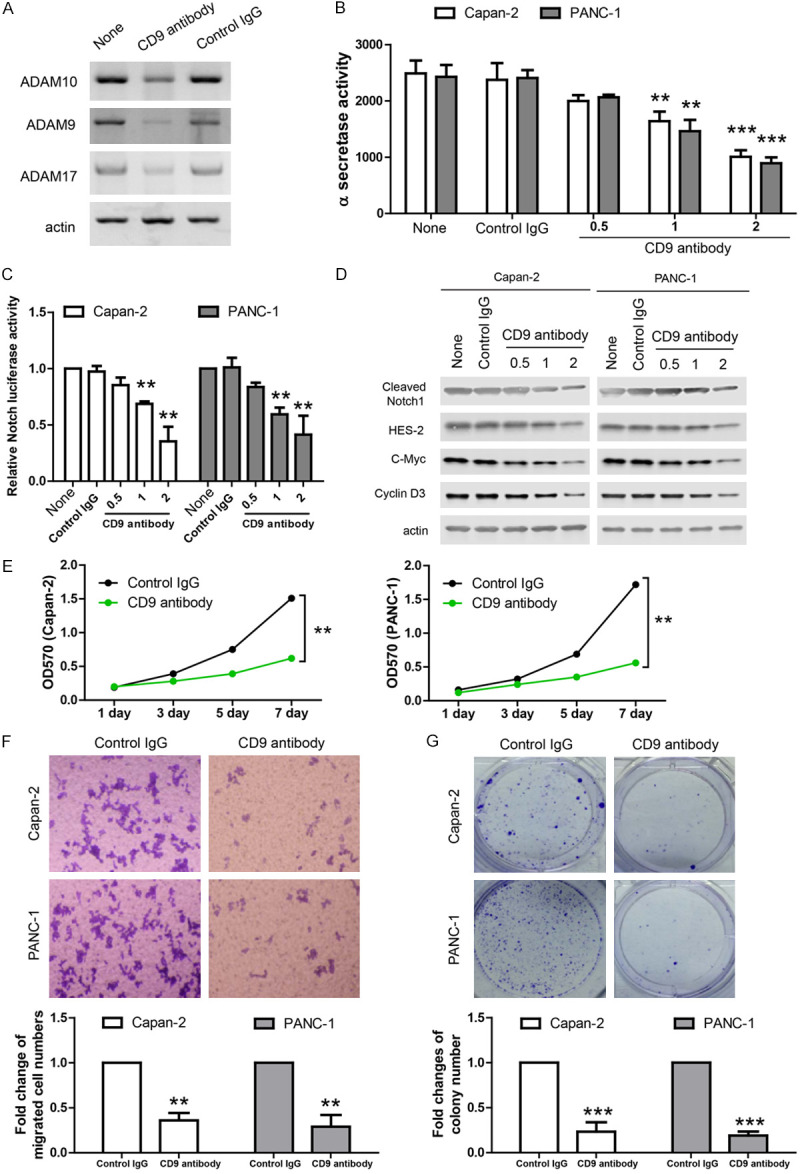
CD9 antibody inhibits α-secretase activity and modulates behaviors of PDAC cell lines. A. Cell surface biotin labeling results showing the protein levels of ADAM10, ADAM9 and ADAM17 on the cell surface were reduced after CD9 antibody incubation. B. In-vitro FRET assay showing α-secretase activity was inhibited after CD9 antibody incubation in two cell lines. C. Luciferase assay showing Notch activity was inhibited after CD9 antibody incubation in two cell lines. D. Western blots showing the protein levels of cleaved Notch1, HES-2, c-Myc and cyclin D3 were reduced after CD9 antibody incubation in two cell lines. E. MTT assay showing the proliferation of PDAC cell lines was inhibited by CD9 antibody. F. Transwell assay showing the migration of PDAC cell lines was inhibited by CD9 antibody. G. Colony formation of PDAC cell lines was inhibited by CD9 antibody. For all, **P<0.01, ***P<0.001.
As previous studies show that ADAM family is involved in aggressive tumor behaviors like cell proliferation, migration and tumor formation, we evaluated the effects of CD9 antibody on those tumor behaviors in two PDAC cell lines. In MTT assay, CD9 antibody inhibited tumor cell proliferation (Figure 6E). In transwell migration assay, CD9 antibody inhibited tumor cell migartion (Figure 6F). In colony formation assay, CD9 reduced the colony numbers (Figure 6G). Taken together, these data suggest that CD9 antibody inhibits α-secretase activity and aggressive behaviors of PDAC cells in in-vitro assays.
Discussion
ADAM family proteins like ADAM10, ADAM9 and ADAM17 which function as α-secretase may be promising therapeutic targets in PDAC, but it is almost unknown whether and how α-secretase is regulated in PDAC. Here, we show that the expression of tetraspanin CD9 was increased and strongly associated with poor prognosis in PDAC. CD9 was also positively associated with α-secretase activity in PDAC tissues. Consistently, CD9 knock-down inhibited α-Secretase activity in PDAC cell lines. Co-IP and GST pull down demonstrates the direct interactions of CD9 with ADAM10, ADAM9 or ADAM17. Cell surface labeling shows that CD9 promoted cell surface trafficking of ADAM family proteins. In addition, the antibody targeting extracellular domain of CD9 disrupted the interactions between CD9 and ADAM family proteins, reduced cell surface trafficking of ADAM proteins, inhibited α-secretase activity, suppressed Notch signaling and showed anti-tumor effects in in-vitro assays. Thus, CD9 antibody might be a potential intervention for PDAC by disrupting CD9-ADAM10/ADAM9/ADAM17 interactions and inhibiting α-secretase activity.
Tetraspanins are a large group of membrane proteins with 33 members in human [21]. They share a common structure of four transmembrane alpha-helices and two extracellular domains. Tetraspanins act as scaffolding proteins by interacting with numerous partners. Through this dynamic interactome, tetraspanins contribute to physiological processes like pancreas development [22], reproduction [23,24], and immunity [25]. In addition, tetraspanins are involved in various cancers as studies show that tetraspanins expression correlates with tumor stage and prognosis [26]. Among the CD9 binding partners, ADAM family has been shown to play important roles in multiple processes. The interaction of CD9 with ADAM10 was found in colon cancer cells [27] and immune cells [16]. The interaction of CD9 with ADAM17 was reported in endothelial and monocytic cells [19]. These results are fully consistent with our current findings in PDAC.
Given the great potential as therapeutic targets, chemical inhibitors against ADAM family proteins are developed. INCB7839 is a dual inhibitor for ADAM17/ADAM10 and a clinical trial is ongoing in which INCB7839 is used in combination with rituximab for the treatment of diffuse large B-cell non-Hodgkin lymphoma [28]. It would be of great interest to test if these inhibitors are effective in PDAC patients. However, it’s unclear if they will produce any side effect in the brain because α-secretase activity is required for normal brain function. As shown in our current study, another strategy to modulate α-secretase could be targeting CD9-ADAM interactions with CD9 antibody. Interestingly, ADAM10 expression is up-regulated in gastric cancer [29] and CD9 antibody shows therapeutic effects in nude mouse model with gastric cancer cell line [30]. Thus, it would be of great interest to evaluate the effects of CD9 antibody in PDAC.
In summary, we report that CD9 interacts with α-secretase to enhance its oncogenic function in pancreatic cancer and targeting the interaction between CD9 and ADAM proteins with antibody may be effective for PDAC treatment.
Acknowledgements
This work was supported by Shanghai Specialized Research Fund for Integrated Chinese and Western Medicine in General Hospitals-ZHYY-ZXYJHZX-201914.
Disclosure of conflict of interest
None.
References
- 1.Kleeff J, Michalski C, Friess H, Buchler MW. Pancreatic cancer - from bench to 5-year survival. Pancreas. 2006;33:111–118. doi: 10.1097/01.mpa.0000229010.62538.f2. [DOI] [PubMed] [Google Scholar]
- 2.Waddell N, Pajic M, Patch AM, Chang DK, Kassahn KS, Bailey P, Johns AL, Miller D, Nones K, Quek K, Quinn MCJ, Robertson AJ, Fadlullah MZH, Bruxner TJC, Christ AN, Harliwong I, Idrisoglu S, Manning S, Nourse C, Nourbakhsh E, Wani S, Wilson PJ, Markham E, Cloonan N, Anderson MJ, Fink JL, Holmes O, Kazakoff SH, Leonard C, Newell F, Poudel B, Song S, Taylor D, Waddell N, Wood S, Xu QY, Wu JM, Pinese M, Cowley MJ, Lee HC, Jones MD, Nagrial AM, Humphris J, Chantrill LA, Chin V, Steinmann AM, Mawson A, Humphrey ES, Colvin EK, Chou A, Scarlett CJ, Pinho AV, Giry-Laterriere M, Rooman I, Samra JS, Kench JG, Pettitt JA, Merrett ND, Toon C, Epari K, Nguyen NQ, Barbour A, Zeps N, Jamieson NB, Graham JS, Niclou SP, Bjerkvig R, Grutzmann R, Aust D, Hruban RH, Maitra A, Iacobuzio-Donahue CA, Wolfgang CL, Morgan RA, Lawlor RT, Corbo V, Bassi C, Falconi M, Zamboni G, Tortora G, Tempero MA Australian Pancreatic Cancer Genome Initiative. Gill AJ, Eshleman JR, Pilarsky C, Scarpa A, Musgrove EA, Pearson JV, Biankin AV, Grimmond SM. Whole genomes redefine the mutational landscape of pancreatic cancer. Nature. 2015;518:495–501. doi: 10.1038/nature14169. [DOI] [PMC free article] [PubMed] [Google Scholar]
- 3.Raphael BJ Cancer Genome Atlas Research Network. Integrated genomic characterization of pancreatic ductal adenocarcinoma. Cancer Cell. 2017;32:185–203. e13. doi: 10.1016/j.ccell.2017.07.007. [DOI] [PMC free article] [PubMed] [Google Scholar]
- 4.Ledford H. The ras Renaissance. Nature. 2015;520:278–280. doi: 10.1038/520278a. [DOI] [PubMed] [Google Scholar]
- 5.Lichtenthaler SF. Alpha-secretase in Alzheimer’s disease: molecular identity, regulation and therapeutic potential. J Neurochem. 2011;116:10–21. doi: 10.1111/j.1471-4159.2010.07081.x. [DOI] [PubMed] [Google Scholar]
- 6.Saftig P, Lichtenthaler SF. The alpha secretase ADAM10: a metalloprotease with multiple functions in the brain. Proc Natl Acad Sci U S A. 2017;114:E9135–E9144. doi: 10.1016/j.pneurobio.2015.10.003. [DOI] [PubMed] [Google Scholar]
- 7.Hotoda N, Koike H, Sasagawa N, Ishiura S. A secreted form of human ADAM9 has an alpha-secretase activity for APP. Biochem Biophys Res Commun. 2002;293:800–5. doi: 10.1016/S0006-291X(02)00302-9. [DOI] [PubMed] [Google Scholar]
- 8.Asai M, Hattori C, Szabo B, Sasagawa N, Maruyama K, Tanuma S, Ishiura S. Putative function of ADAM9, ADAM10, and ADAM17 as APP alpha-secretase. Biochem Biophys Res Commun. 2003;301:231–5. doi: 10.1016/s0006-291x(02)02999-6. [DOI] [PubMed] [Google Scholar]
- 9.Pruessmeyer J, Ludwig A. The good, the bad and the ugly substrates for ADAM10 and ADAM17 in brain pathology, inflammation and cancer. Semin Cell Dev Biol. 2009;20:164–74. doi: 10.1016/j.semcdb.2008.09.005. [DOI] [PubMed] [Google Scholar]
- 10.Arribas J, Bech-Serra JJ, Santiago-Josefat B. ADAMs, cell migration and cancer. Cancer Metastasis Rev. 2006;25:57–68. doi: 10.1007/s10555-006-7889-6. [DOI] [PubMed] [Google Scholar]
- 11.Wojtalewicz N, Sadeqzadeh E, Weiss JV, Tehrani MM, Klein-Scory S, Hahn S, Schmiegel W, Warnken U, Schnolzer M, de Bock CE, Thorne RF, Schwarte-Waldhoff I. A soluble form of the giant cadherin Fat1 Is released from pancreatic cancer cells by ADAM10 mediated ectodomain shedding. PLoS One. 2014;9:e90461. doi: 10.1371/journal.pone.0090461. [DOI] [PMC free article] [PubMed] [Google Scholar]
- 12.Woods N, Trevino J, Coppola D, Chellappan S, Yang SY, Padmanabhan J. Fendiline inhibits proliferation and invasion of pancreatic cancer cells by interfering with ADAM10 activation and beta-catenin signaling. Oncotarget. 2015;6:35931–35948. doi: 10.18632/oncotarget.5933. [DOI] [PMC free article] [PubMed] [Google Scholar]
- 13.Gaida MM, Haag N, Gunther F, Tschaharganeh DF, Schirmacher P, Friess H, Giese NA, Schmidt J, Wente MN. Expression of a disintegrin and metalloprotease 10 in pancreatic carcinoma. Int J Mol Med. 2010;26:281–8. doi: 10.3892/ijmm_00000463. [DOI] [PubMed] [Google Scholar]
- 14.Oria VO, Lopatta P, Schmitz T, Preca BT, Nystrom A, Conrad C, Bartsch JW, Kulemann B, Hoeppner J, Maurer J, Bronsert P, Schilling O. ADAM9 contributes to vascular invasion in pancreatic ductal adenocarcinoma. Mol Oncol. 2019;13:456–479. doi: 10.1002/1878-0261.12426. [DOI] [PMC free article] [PubMed] [Google Scholar]
- 15.Ringel J, Jesnowski R, Moniaux N, Luttges J, Ringel J, Choudhury A, Batra SK, Kloppel G, Lohr M. Aberrant expression of a disintegrin and metalloproteinase 17/tumor necrosis factor-alpha converting enzyme increases the malignant potential in human pancreatic ductal adenocarcinoma. Cancer Res. 2006;66:9045–9053. doi: 10.1158/0008-5472.CAN-05-3287. [DOI] [PubMed] [Google Scholar]
- 16.Arduise C, Abache T, Li L, Billard M, Chabanon A, Ludwig A, Mauduit P, Boucheix C, Rubinstein E, Le Naour F. Tetraspanins regulate ADAM10-mediated cleavage of TNF-alpha and epidermal growth factor. J Immunol. 2008;181:7002–7013. doi: 10.4049/jimmunol.181.10.7002. [DOI] [PubMed] [Google Scholar]
- 17.Dornier E, Coumailleau F, Ottavi JF, Moretti J, Boucheix C, Mauduit P, Schweisguth F, Rubinstein E. TspanC8 tetraspanins regulate ADAM10/Kuzbanian trafficking and promote Notch activation in flies and mammals. J Cell Biol. 2012;199:481–496. doi: 10.1083/jcb.201201133. [DOI] [PMC free article] [PubMed] [Google Scholar]
- 18.Haining EJ, Yang J, Bailey RL, Khan K, Collier R, Tsai S, Watson SP, Frampton J, Garcia P, Tomlinson MG. The TspanC8 subgroup of tetraspanins interacts with A disintegrin and metalloprotease 10 (ADAM10) and regulates its maturation and cell surface expression. J Biol Chem. 2012;287:39753–65. doi: 10.1074/jbc.M112.416503. [DOI] [PMC free article] [PubMed] [Google Scholar]
- 19.Gutierrez-Lopez MD, Gilsanz A, Yanez-Mo M, Ovalle S, Lafuente EM, Dominguez C, Monk PN, Gonzalez-Alvaro I, Sanchez-Madrid F, Cabanas C. The sheddase activity of ADAM17/TACE is regulated by the tetraspanin CD9. Cell Mol Life Sci. 2011;68:3275–92. doi: 10.1007/s00018-011-0639-0. [DOI] [PMC free article] [PubMed] [Google Scholar]
- 20.Berditchevski F, Odintsova E. Tetraspanins as regulators of protein trafficking. Traffic. 2007;8:89–96. doi: 10.1111/j.1600-0854.2006.00515.x. [DOI] [PubMed] [Google Scholar]
- 21.Lazo PA. Functional implications of tetraspanin proteins in cancer biology. Cancer Sci. 2007;98:1666–1677. doi: 10.1111/j.1349-7006.2007.00584.x. [DOI] [PMC free article] [PubMed] [Google Scholar]
- 22.Jarikji Z, Horb LD, Shariff F, Mandato CA, Cho KWY, Horb ME. The tetraspanin Tm4sf3 is localized to the ventral pancreas and regulates fusion of the dorsal and ventral pancreatic buds. Development. 2009;136:1791–1800. doi: 10.1242/dev.032235. [DOI] [PMC free article] [PubMed] [Google Scholar]
- 23.Kaji K, Oda S, Shikano T, Ohnuki T, Uematsu Y, Sakagami J, Tada N, Miyazaki S, Kudo A. The gamete fusion process is defective in eggs of Cd9-deficient mice. Nat Genet. 2000;24:279–282. doi: 10.1038/73502. [DOI] [PubMed] [Google Scholar]
- 24.Le Naour F, Rubinstein E, Jasmin C, Prenant M, Boucheix C. Severely reduced female fertility in CD9-deficient mice. Science. 2000;287:319–321. doi: 10.1126/science.287.5451.319. [DOI] [PubMed] [Google Scholar]
- 25.Levy S, Shoham T. The tetraspanin web modulates immune-signalling complexes. Nat Rev Immunol. 2005;5:136–148. doi: 10.1038/nri1548. [DOI] [PubMed] [Google Scholar]
- 26.Hemler ME. Tetraspanin proteins promote multiple cancer stages. Nat Rev Cancer. 2014;14:49–60. doi: 10.1038/nrc3640. [DOI] [PubMed] [Google Scholar]
- 27.Le Naour F, Andre M, Greco C, Billard M, Sordat B, Emile JF, Lanza F, Boucheix C, Rubinstein E. Profiling of the tetraspanin web of human colon cancer cells. Mol Cell Proteomics. 2006;5:845–857. doi: 10.1074/mcp.M500330-MCP200. [DOI] [PubMed] [Google Scholar]
- 28.Ahmadzadeh V, Tofigh R, Farajnia S, Pouladi N. The central role for microenvironment in B-cell malignancies: recent insights into synergistic effects of its therapeutic targeting and anti-CD20 antibodies. Int Rev Immunol. 2016;35:136–55. doi: 10.3109/08830185.2015.1077830. [DOI] [PubMed] [Google Scholar]
- 29.Wang YY, Ye ZY, Li L, Zhao ZS, Shao QS, Tao HQ. ADAM 10 is associated with gastric cancer progression and prognosis of patients. J Surg Oncol. 2011;103:116–23. doi: 10.1002/jso.21781. [DOI] [PubMed] [Google Scholar]
- 30.Nakamoto T, Murayama Y, Oritani K, Boucheix C, Rubinstein E, Nishida M, Katsube F, Watabe K, Kiso S, Tsutsui S, Tamura S, Shinomura Y, Hayashi N. A novel therapeutic strategy with anti-CD9 antibody in gastric cancers. J Gastroenterol. 2009;44:889–96. doi: 10.1007/s00535-009-0081-3. [DOI] [PubMed] [Google Scholar]


