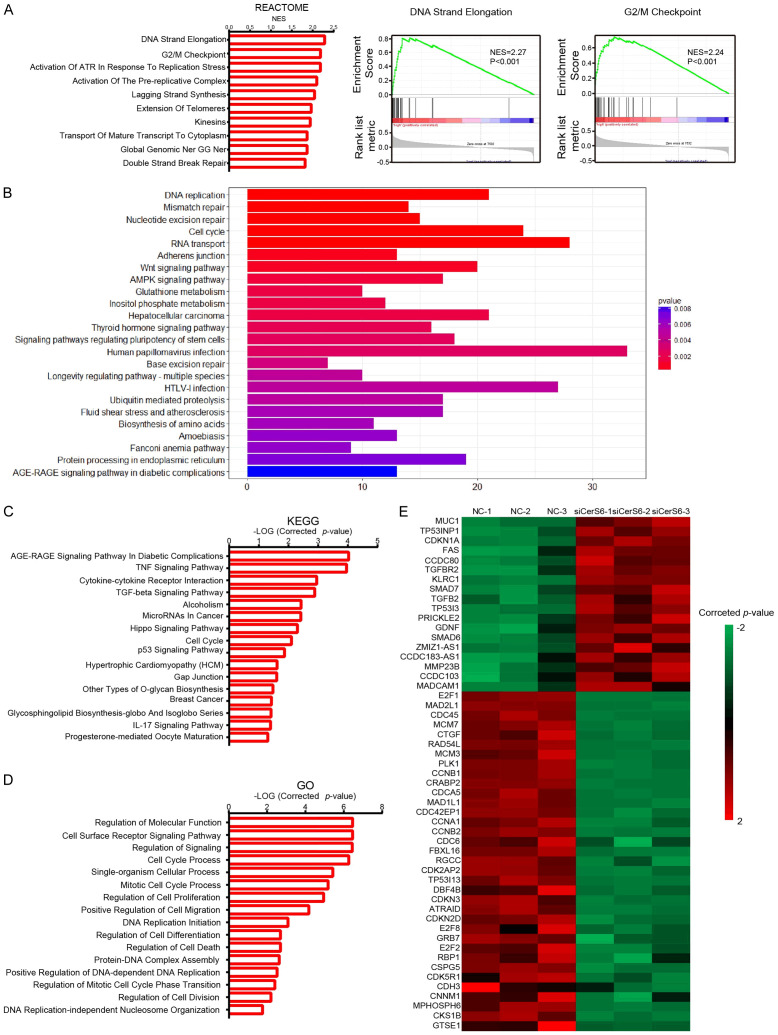
Figure 5.
The database and RNA-seq analysis of CerS6. A. GSEA using Reactome gene sets was performed to compare the data from the TCGA ovarian cancer database. NES, normalized enrichment score. B. R analysis using KEGG pathway gene sets was performed to compare the data from the TCGA ovarian cancer database. C. Representative KEGG categories affected by CerS6 expression in OVCAR8 cells. D. Representative GO categories affected by CerS6 expression in OVCAR8 cells. E. Heat map of cell cycle molecules (GO: 0022402) from gene expression profiling results based on GO analysis (control groups vs siCerS6 groups, P = 5.47E-7).

