Figure 4.

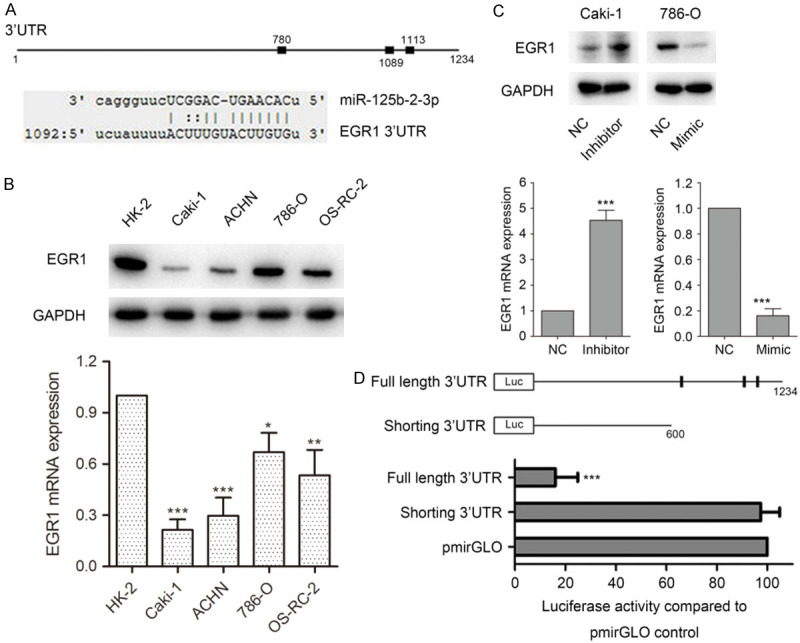
MiR-125b-2-3p directly targets EGR1. A. Schematic diagram of interaction between miR-125b-2-3p and EGR1 3’-UTR. The predicted binding sites of miR-125b-2-3p on EGR1 3’-UTR by online computational algorithms miRDB, TargetMiner and miRanda (Up); the interaction between miR-125b-2-3p and EGR1 3’-UTR at 1113 site predicted by all three algorithms (Down). B. EGR1 was down-regulated in cancer cells compare to HK-2 in both protein and mRNA levels. C. MiR-125b-2-3p negatively regulated EGR1 expression in both protein and mRNA levels. EGR1 expression was detected in both protein and mRNA levels after ccRCC cells transfected miR-125b-2-3p inhibitor or mimic. D. MiR-125b-2-3p directly targets EGR1. Schematic diagram of structures for luciferase assay (Up). Luciferase assay was determined on 786-O cells transfected luciferase vectors together with miR-125b-2-3p mimic (Down).
