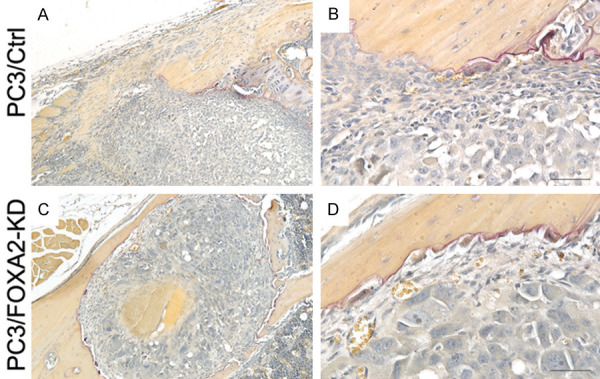
Figure 5.

TRAP staining. (A and B) are images of a tibia injected with PC3/Control cells and (C and D) are images of a tibia injected with PC3/FOXA2-KD cells exhibiting bone lesions. (B and D) are higher magnification pictures of (A and C), respectively. Positive TRAP staining was detected at the tumor/bone interface of the tibiae that showed bone destruction in both PC3/Control and PC3/FOXA2 KD grafts.
