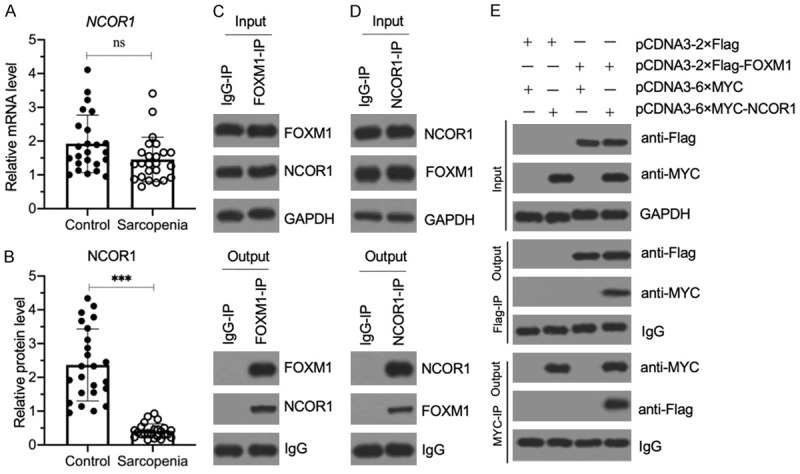
Figure 6.

NCOR1 assembled a transcriptional complex with FOXM1. (A) The relative NCOR1 mRNA level in sarcopenic muscles. The same RNA samples as used in Figure 2B were applied to RT-qPCR analyses to examine the NCOR1 mRNA level. P>0.05 (ns indicates no significance). (B) The relative NCOR1 protein level in sarcopenic muscles. The same muscle tissues as in (A) were used to extract total proteins, and the cell extracts were subjected to immunoblotting to examine NCOR1 and GAPDH (loading control) protein. The relative NCOR1 protein level was determined by normalizing to its corresponding GAPDH level. ***P<0.001. (C and D) FOXM1 and NCOR1 could pull down each other in vivo. Equal weights of three sarcopenic tissues were mixed together, and their homogenates were subjected to IP assays with IgG, anti-FOXM1 (C) and anti-NCOR1 (D), respectively. The input and output proteins were examined for their FOXM1 and NCOR1 protein levels by western blotting. (E) FOXM1 directly interacted with NCOR1 in vitro. The HSMM-1 cells were cotransfected with the plasmid combinations shown in the figure. After culturing for 48 h, the cells were used for Co-IP assays with Flag-agarose and MYC-agarose. The input and output proteins were examined by western blot for their protein levels using anti-Flag and anti-MYC antibodies.
