Figure 1.
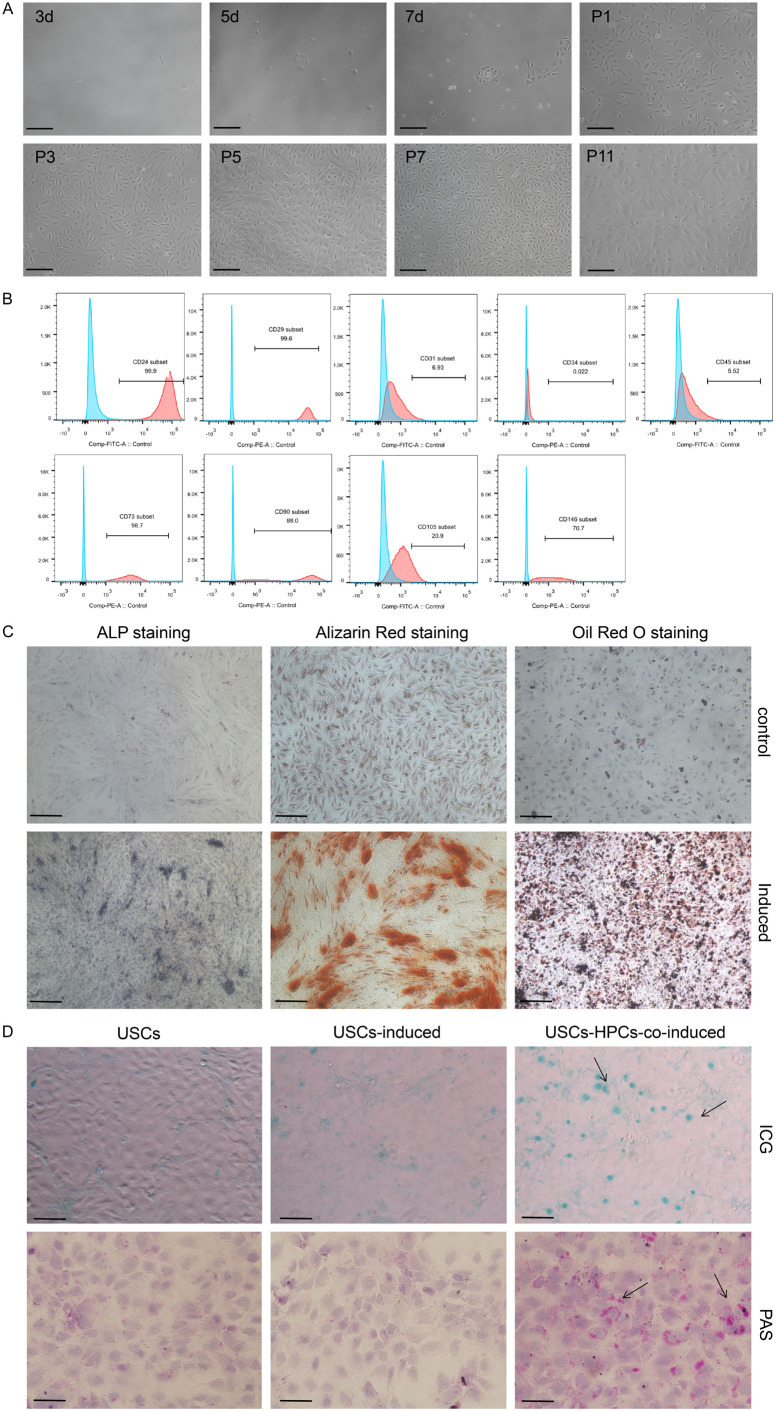
Morphological, molecular, and differentiation characteristics of USCs. A. Cell morphology of USCs on different days of primary passage and additional passages. B. FACS analysis for determining surface antigen expression on passage 3 human USCs. C. Alkaline phosphatase (ALP) staining, alizarin red staining and oil red O staining to measure differentiation potential. D. Indocyanine green (ICG) uptake assay: cells with a green-stained nucleus are the positive-stained cells. Periodic acid-Schiff (PAS) staining, purple color in cell plasma indicates glycogen accumulation. Scale bar =100 μm.

