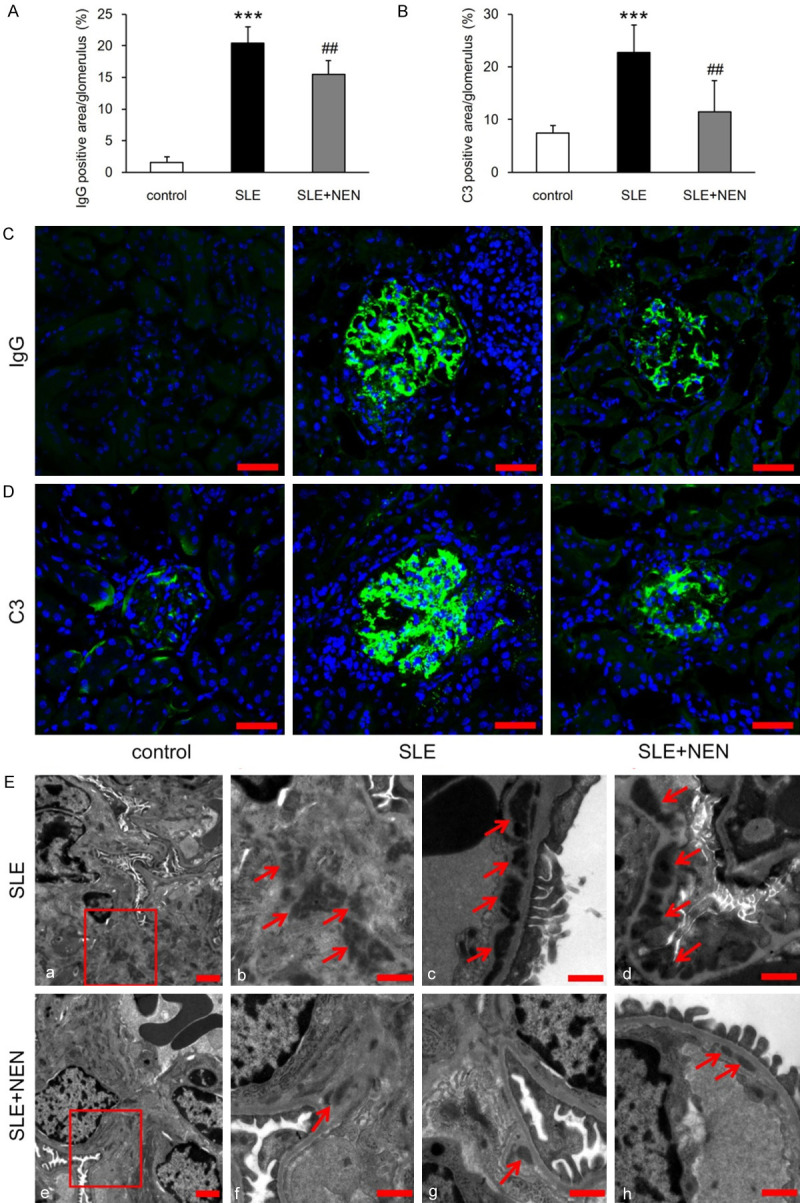
Figure 2.

NEN ameliorated glomerular immune complex deposition. (A, B) Bar graphs indicating the analysis of IgG and C3 deposition in glomeruli from each group. (C, D) Representative immunofluorescence staining images of IgG and C3 in different groups. (E) Representative TEM images displaying the electron dense deposits in glomeruli of SLE and SLE+NEN groups. (a, b, e, f) Mesangial region; (c) Subendothelial region; (d) Subepithelial region; (g, h)Subendothelial region. Scale bar for (a and e), 2 μm; Scale bar for (b-d and f-h), 1 μm. n = 6 per group. ***P<0.001 vs. control group. ##P<0.01 vs. SLE group.
