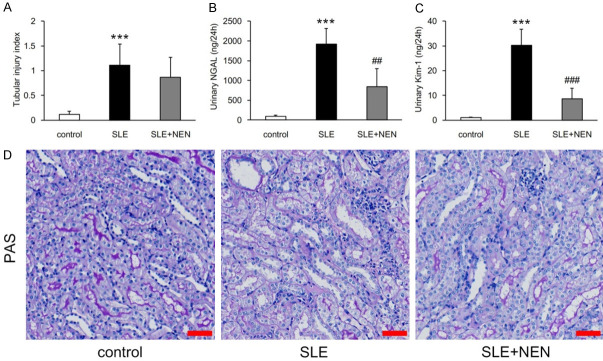
Figure 3.
Effects of NEN treatment on renal tubular injury. A. Evaluation of renal tubular injury index in each group. B, C. Measurement of urinary NGAL and Kim-1 excretion in various groups. D. Representative images of tubule PAS staining. scale bar, 50 μm. n = 6 per group. ***P<0.001 vs. control group. ##P<0.01 and ###P<0.001 vs. SLE group.

