Figure 3.
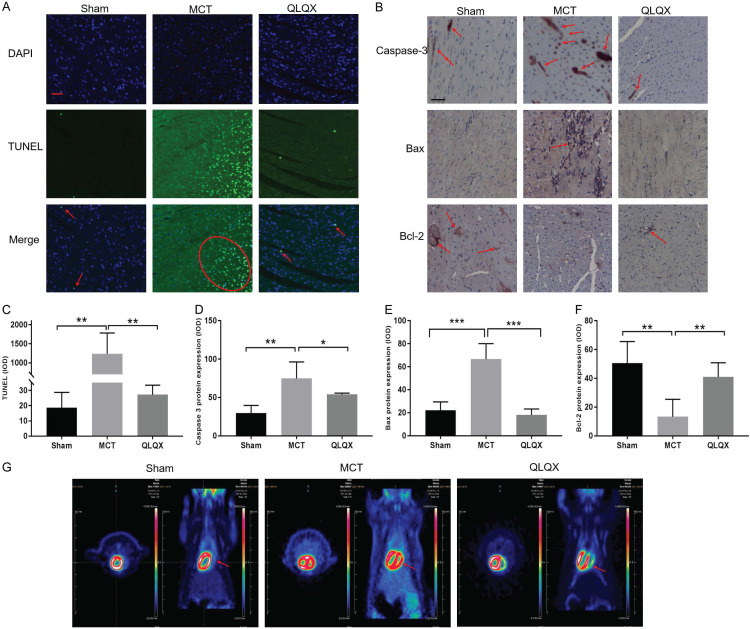
QLQX inhibited RV myocardial apoptosis and reversed metabolic shift. A. Representative images of TUNEL staining in three groups. TUNEL positive stains in bright green. Sham, red arrow; MCT, red oval; QLQX, red arrow. Nuclei stained blue with DAPI. Scale bar, 50 μm. B. Representative images of caspase 3, Bax and Bcl-2 staining in RV myocytes by immunohistochemical staining (red arrow). Scale bar, 50 μm. C. Quantitative changes of the incidence of myocardial apoptosis in RV among various treatment groups. RV myocytes after monocrotaline induced RVF increased apoptosis compared to Sham, while QLQX treatment group significantly decreased compared to MCT group. The percentages of TUNEL positive cells were calculated in 10 randomly chosen fields of each section at ×400 magnification. D-F. Quantification of caspase 3, Bax and Bcl-2 staining in RV myocytes. MCT group had a higher level of cleaved caspase-3, Bax and lower expression of anti-apoptotic protein Bcl-2 than that of control and QLQX groups, while QLQX reversed. G. The representative FDG-PET image was shown in Sham, MCT and QLQX group. FDG-PET detected and quantified the metabolic pattern reversing. Glucose uptake in RV (red arrows) was elevated in MCT group (red zone), while this accumulation was ameliorated after the QLQX treatment. Original magnification, 100×; Scale bar, 50 μm. Data is presented as mean ± SD. ***P<0.0001; **P<0.001; *P<0.05.

