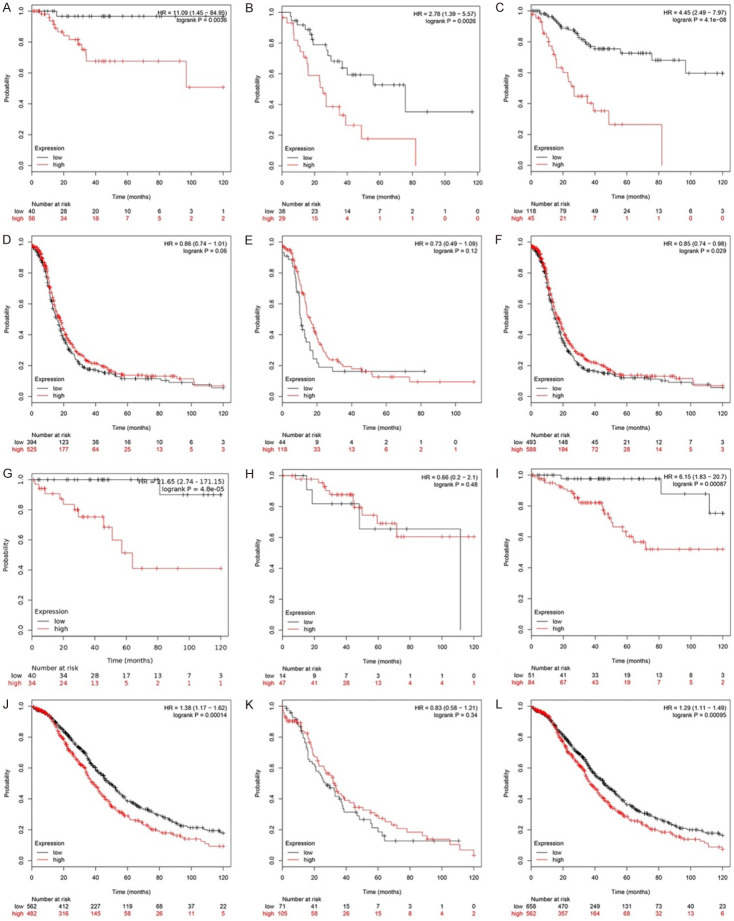
Figure 4.
Relationship between prognosis and KIF23 mRNA expression in patients with different stages of OV. A-C. Relationship between KIF23 expression and PFS in patients with early-stage OV (stage I/II/I + II). D-F. Relationship between KIF23 expression and PFS in patients with advanced OV (stage III/IV). G-I. Relationship between KIF23 expression and OS in patients with early-stage OV (stage I/II/I + II). J-L. Relationship between KIF23 expression and OS in patients with advanced OV (stage III/IV) (Red represents high expression, the black line represents low expression. The abscissa represents the month, the ordinate represents survival rate).

