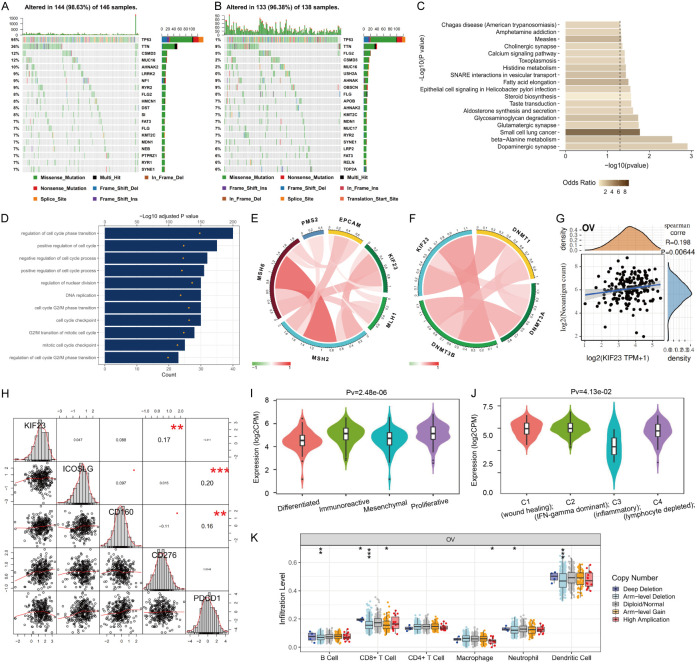
Figure 9.
Molecular mechanism of KIF23 in the development of OV. A. Distribution of common single nucleotide mutations in OV with 98.63% samples altered in KIF23 low expressed group (The bar graph on the right represents the number of mutations of each gene in the total number of samples). B. Distribution of common single nucleotide mutations in OV with 96.38% samples altered in the KIF23 high expressed group (The bar graph on the right represents the number of mutations of each gene in the total number of samples). C. KEGG analysis of enrichment pathway of KIF23 high expression mutant group. D. GO functional enrichment analysis of biological behavior of genes related to KIF23 expression. E. Correlation between KIF23 and MMR key genes (Green represents a negative correlation, red represents positive correlation; the darker the color, the greater the correlation). F. Correlation between KIF23 expression and methyltransferase (Green represents negative correlation, red represents positive correlation; the darker the color, the greater the correlation). G. Correlation between KIF23 expression and Neoantigen count (The abscissa represents KIF23 expression, the ordinate represents Neoantigen count). H. Correlation between KIF23 expression and immune checkpoint protein. I. Correlation between KIF23 expression and molecular subtypes of OV. J. Correlation between KIF23 expression and immune subtypes of OV. K. Correlation between KIF23 expression and infiltration level of different somatic copy number changes in OV (The abscissa represents copy number change, including deep deletion (-2), arm-level deletion (-1), diploid/normal (0), arm-level gain (1), and high amplification (2). Ordinate represents infiltration level).

