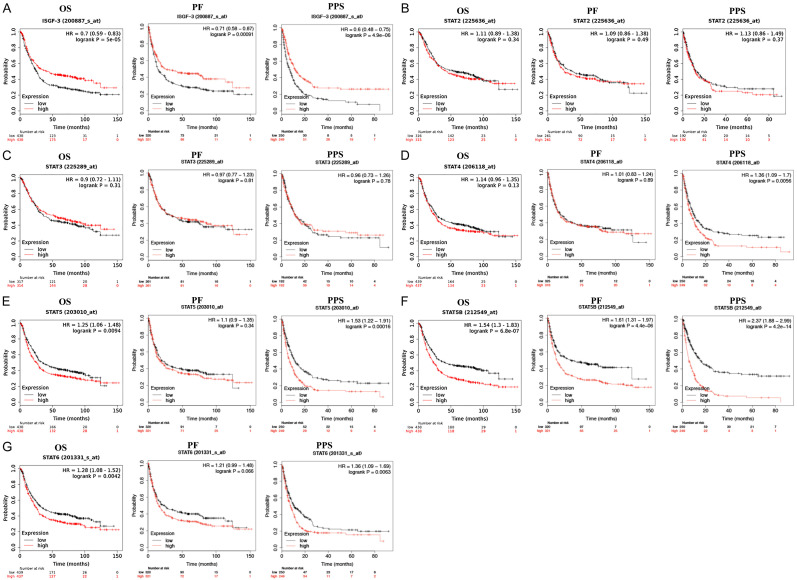
Figure 3.
The prognostic value of STAT family in STAD (KM plotter). A. STAD patients with high STAT1 mRNA level had a better OS, PF and PPS. B, C. The mRNA levels of STAT2 and STAT3 had no effect on STAD patients’ prognosis (OS, PF, and PPS). D. STAD patients with high STAT1 mRNA level had a worse PPS. E. STAD patients with high STAT5A level would experience a poor OS and PPS. F. STAD patients with high STAT5B level would experience a poor OS, PF, and PPS. G. STAD patients with high STAT6 level had a poor OS and PPS. All the analyses were performed with Kaplan-Meier analysis. HR, Hazard Ratio; OS, overall survival; PPS, post progression survival; FP, first progression.

