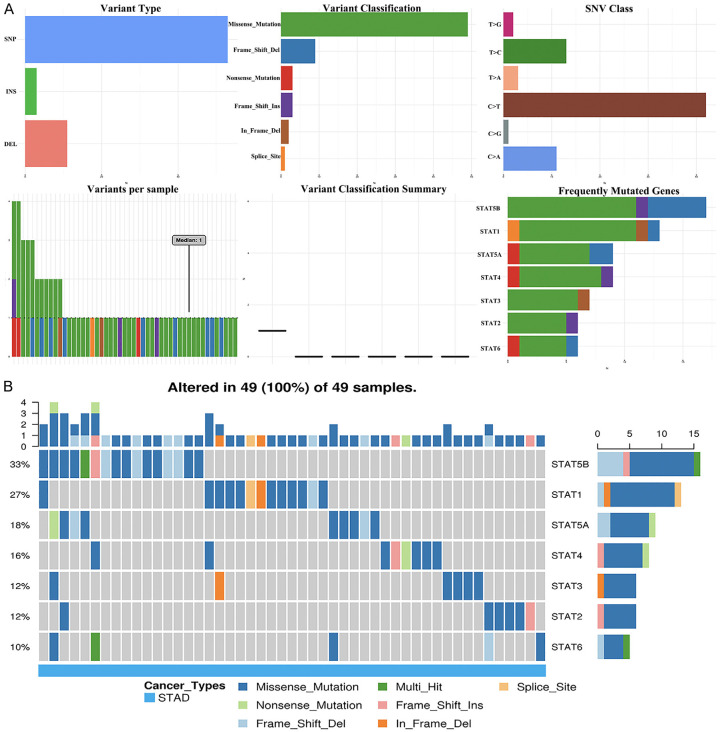
Figure 5.
The single nucleotide variation (SNV) analysis of STAT family in STAD (GSCALite). A. Summary plot displays SNV frequency and variant types of STAT family in STAD, and genetic alteration of STAT family constitutes SNP, insertion and deletion. B. Waterfall plot shows the mutation distribution of STAT family in STAD and STAT5B (33%), STAT1 (27%), and STAT5A (18%) were the top three frequently mutated genes among all the numbers of STAT family.

