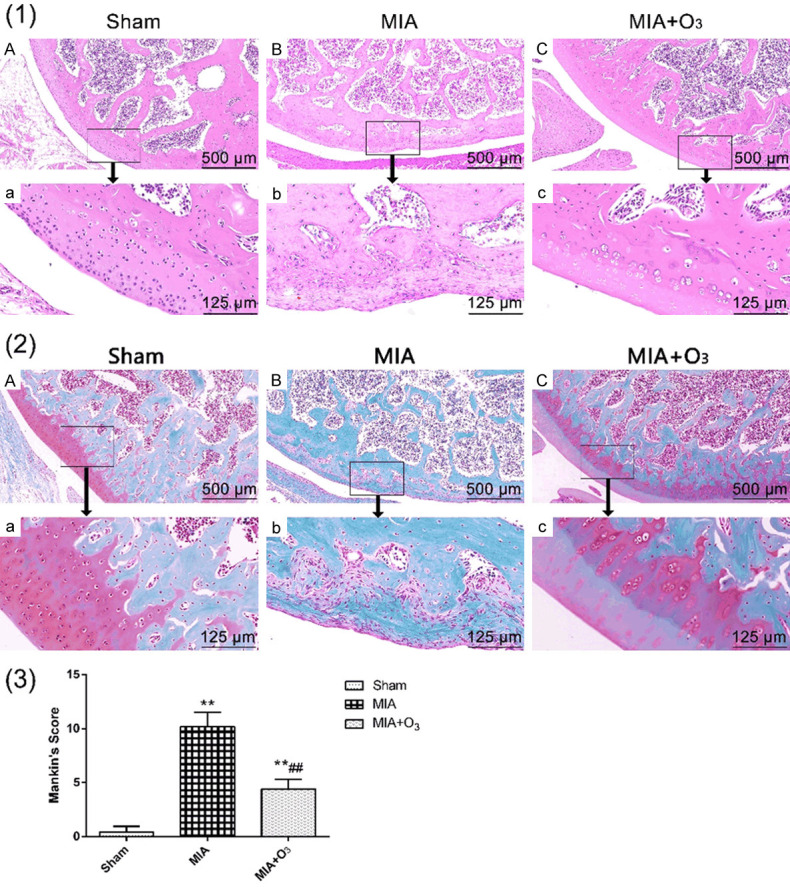
Figure 2.

Effects of O3 on HE staining and safranin O-fast green staining of knee joints of OA rats (n=8). (1) The cartilage surface in the MIA group was rough, with a degenerate shape and a significantly decreased number of chondrocytes. Compared with the MIA group, the MIA+O3 group had increased cartilage thickness and a smooth cartilage surface. The MIA+O3 group had significantly deeper matrix staining and more uniform coloring than the MIA group. (2) The structure was disordered in the MIA group, and the tidal line was fuzzy and interrupted. Safranin O staining markedly decreased or even disappeared in the MIA group. The articular cartilage structure in the MIA+O3 group was still clear, and the tidal line was continuous. Safranin O staining slightly diminished. (3) The Mankin’s score of the MIA group was significantly higher than that of the Sham group, while the Mankin’s score of the MIA+O3 group was significantly lower than that of the MIA group. *P<0.05, **P<0.01 vs. Sham; #P<0.05, ##P<0.01, vs. MIA.
