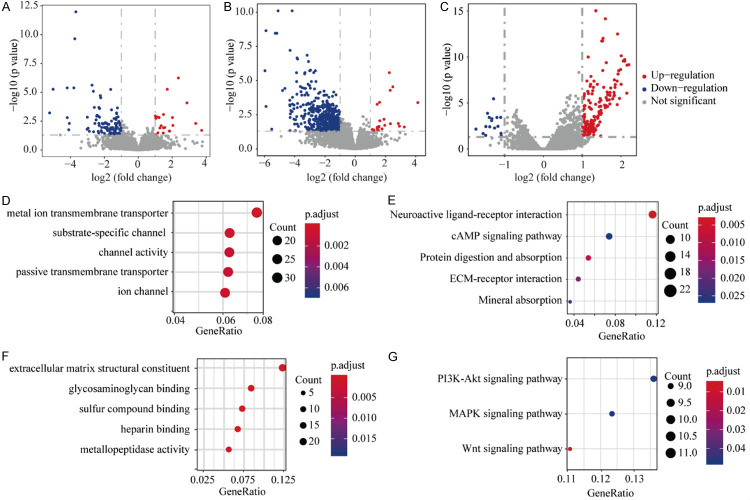
Figure 5.
Volcano plots, and GO and KEGG annotation maps, for differentially expressed genes (DEGs). A. 110 genes were downregulated, and 26 genes were upregulated, in the mRNAsi-high group compared to the mRNAsi-low group for CGA HCC samples. B. 546 genes were downregulated, and 23 genes were upregulated, in the mDNAsi-high group compared to the mDNAsi-low group for CGA HCC samples. C. 16 genes were downregulated, and 174 genes were upregulated in the mDNAsi-high group compared to the mRNAsi-low group for ICGC HCC samples. D. The GO annotation map for the top 5 (out of 569) mDNAsi DEGs in the CGA HCC samples. E. The KEGG annotation map for the top 5 mDNAsi DEGs in the CGA HCC samples. F. The GO annotation map for the top 5 (out of 569) mRNAsi DEGs in the ICGC HCC samples. G. The KEGG annotation map for the top 3 mRNAsi DEGs in the ICGC HCC samples. *FDR < 0.05. GO: Gene Ontology; KEGG: Kyoto Encyclopedia of Genes and Genomes; DEGs: differentially expressed genes.

