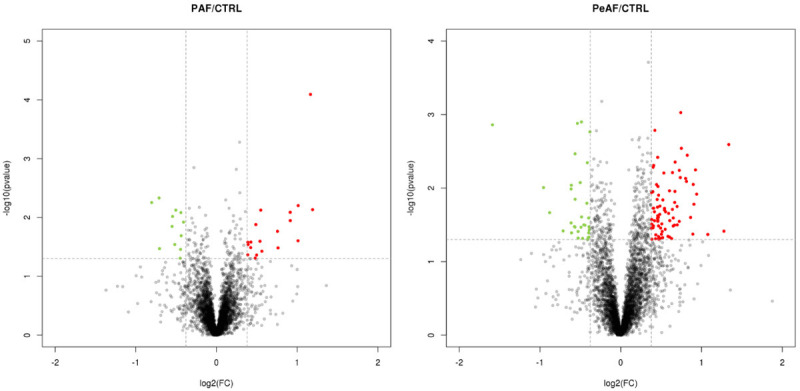
Figure 3.

Differentially expressed proteins in left atrial appendage tissue of PAF and PeAF patients compared with control subjects (CTRL). PAF/CTRL: Volcano plot of protein changes in left atrial appendage tissue of PAF and CTRL groups. There were 30 proteins with fold change of > 1.5 or < 0.67 and p-values < 0.05 were identified as significantly dysregulated. PeAF/CTRL: There were 108 proteins with fold change of > 1.5 or < 0.67 and p-values < 0.05 were identified as significantly dysregulated.
