
Figure 3.
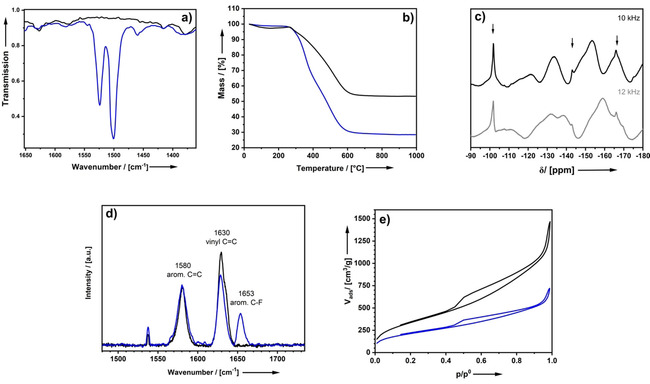
FTIR spectra (a), TGA (b), 19F solid‐state NMR spectra at different rotation speeds to eliminate ration sidebands (c), FT‐Raman (d) and N2‐physisorption isotherms (e) of 2 (black) compared to 3 b (blue) after intrapore polymerization of 2,3,4,5,6‐pentafluorostyrene.