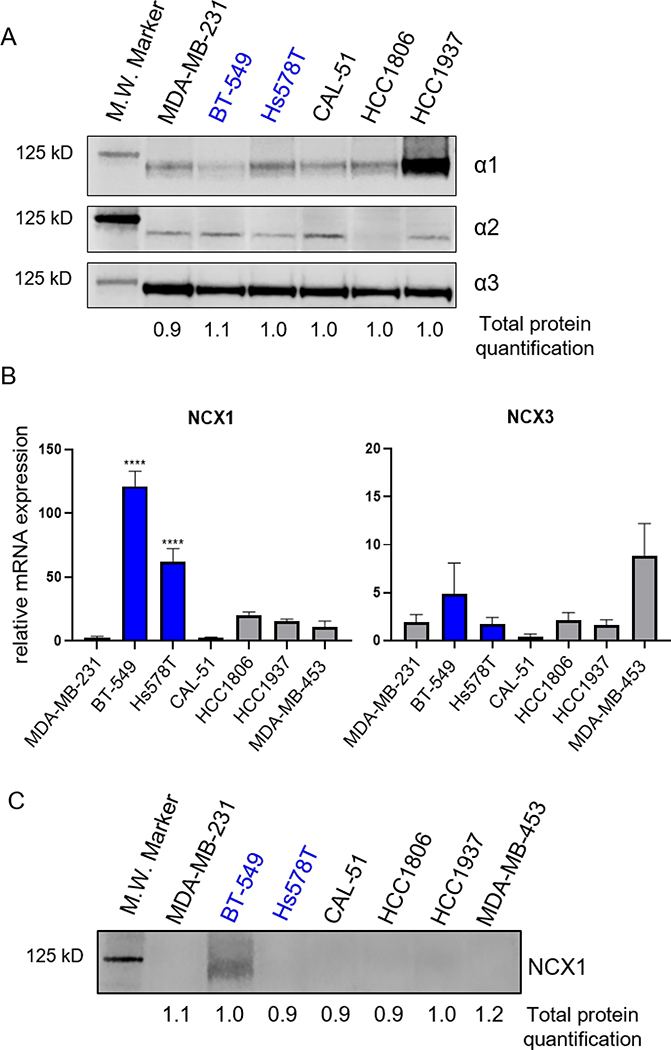
Figure 5.
Expression of Na+/K+ ATPase isoforms and of Na+/Ca2+ exchanger in TNBC cells. Cell lines sensitive to cardenolides/cardiac glycosides in blue. A) Western blot of 30 ug of membrane enriched cell lysates were probed for Na+/K+ ATPase a subunit isoforms, α1, α2 and α3. B) mRNA expression of NCX1 and NCX3 determined by qRT-PCR and represented as fold difference compared to MDA-MB-231, n = 3–5 independent experiments. Significance determined by one-way ANOVA with Tukey’s post hoc test **** p < 0.0001, *** p < 0.001 C) Western blot of 75 μg of membrane enriched cell lysates for NCX1. Blots are representative of 3 independent experiments.

