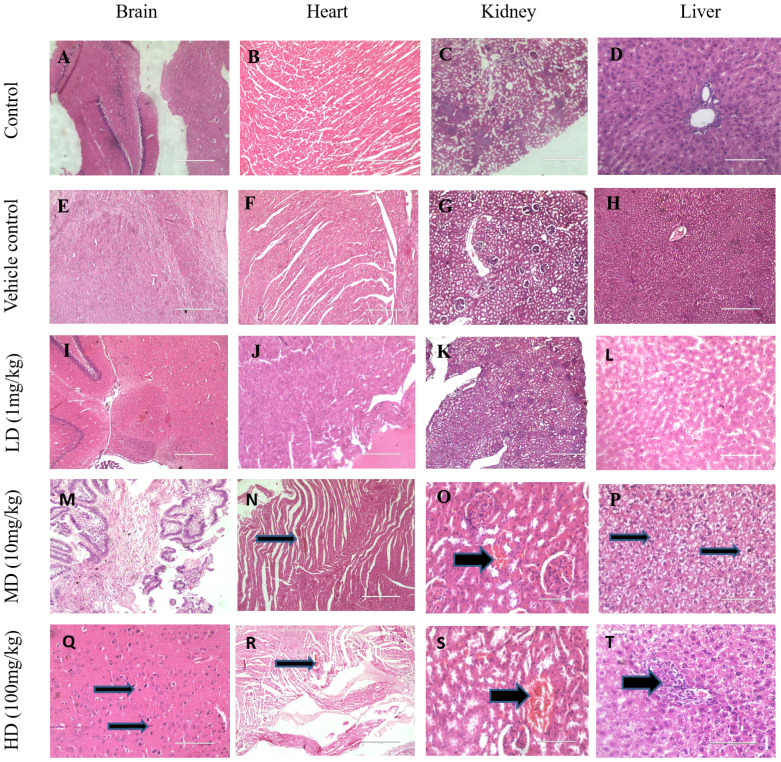
Figure 4.
Histological evaluation of IONPs on various tissues. Representative images of brain, heart, kidney and liver of control, vehicle control and IONPs (1 mg/kg, 10 mg/kg, 100 mg/kg) treated groups where organs collected after 28 days of oral administration. Sections were stained with H&E and observed under a light microscope at 10X & 40X magnification.

