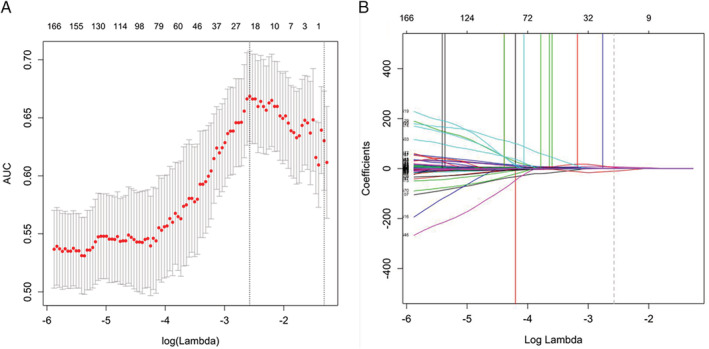
Figure 2.

Selection of texture features by the elastic net logistic regression model. α = 0.5. A, Tuning index (λ) selection in the elastic net model used 10‐fold cross‐validation based on the minimum criterion. An ROC curve was plotted against logλ. Dotted vertical lines indicate optimal values based on the minimum criterion and 1 SE of the minimum criterion. λ = 0.076 (logλ = −2.575) was selected (minimum criterion). B, Elastic net coefficients of the 626 texture features. Coefficients were plotted against logλ values. The vertical line was plotted at the value obtained by the above 10‐fold cross‐validation. A total of 21 resulting features showing nonzero coefficients are indicated.
