
Figure 5.
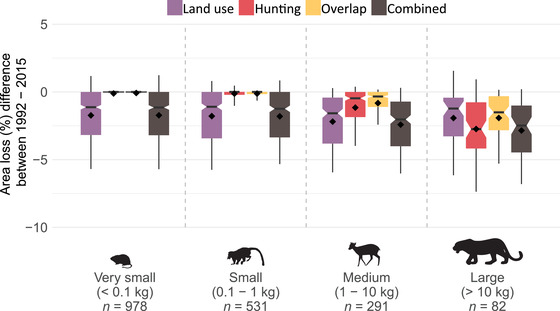
Changes in distribution‐size losses due to land use and hunting pressure from 1992 to 2015 (negative values, loss of area from 1992 to 2015; positive values, gain of area; diamonds, mean values per group; lower and upper box boundaries, 25th and 75th percentiles, thick horizontal line, median; notch, 95% CI around the estimate of the median; whiskers, 10–90 percentile). Summary statistics in Supporting Information.