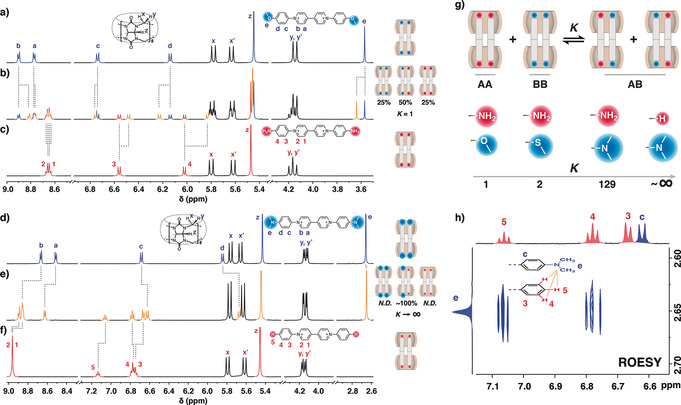
Figure 2.

1H NMR spectra of CB[8]‐directed homodimers of a) VOMe, c) VNH2, d) VNMe2, f) VH, and the equilibrium products of b) a 50/50 mixture of VOMe and VNH2 homodimers as well as e) a 50/50 mixture of VNMe2 and VH homodimers. g) The equilibrium constant K obtained from integration analysis displays a correlation with the shape complementarity between end‐groups. h) ROESY NMR spectrum of VNMe2 and VH homodimer mixture shows a clear cross‐correlation between the N,N‐dimethylamino substituent of VNMe2 and the phenyl group of VH. The Cl− counterions are omitted for clarity.
