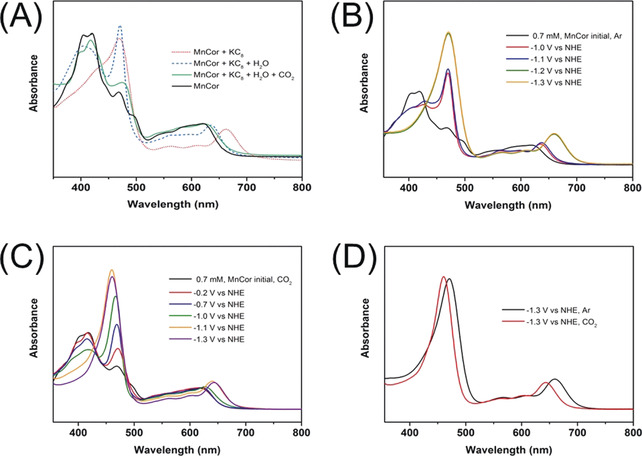
Figure 3.

A) EAS of Mn‐corrole in acetonitrile under argon (black solid line), the chemically reduced form in presence of KC8 (red dotted line), after the addition of water (blue, dashed line), and subsequent dosage of CO2 (green solid line). B–D) Potential dependent SEC‐UV/Vis of 0.7 mm Mn‐corrole in acetonitrile with 2 % water and 0.2 m TBAPF6 as electrolyte after 2 min CPE (B) under Argon (C) under CO2, and (D) comparison of UV/Vis spectra observed at −1.3 V vs. NHE under Argon (black) and CO2 dosage (red). SEC‐UV/Vis measurements were recorded with a light transparent platinum mini‐grid as working, as counter and an Ag‐microwire as pseudo‐reference electrode.
