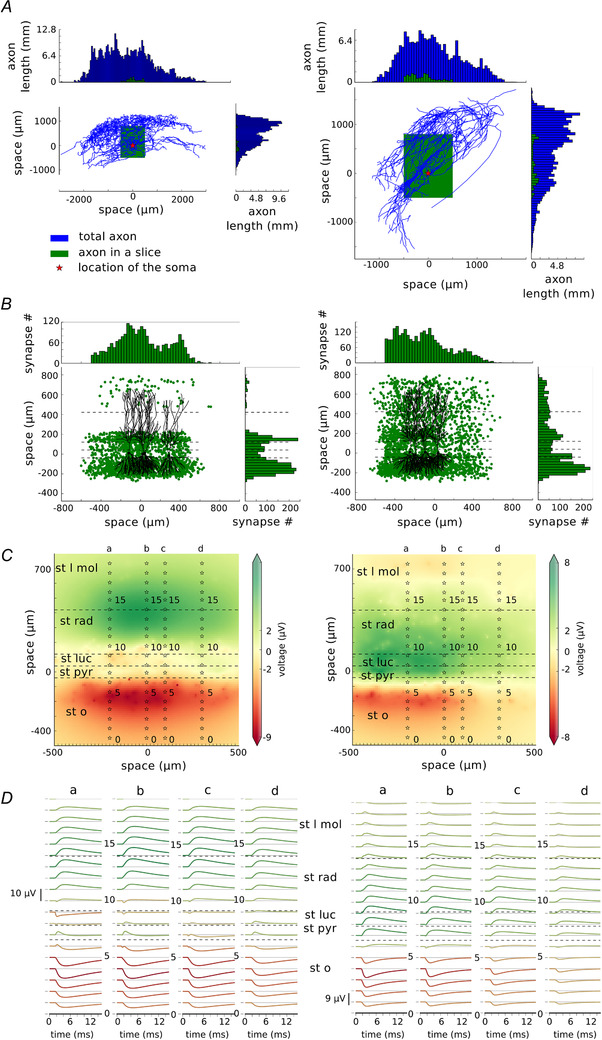
Figure 5. Excitatory unitary field.

A, axon morphologies of two CA3 pyramidal cells, Cell A (left, ID: NMO 00187) and Cell B (ID: NMO 00931) downloaded from NeuroMorpho.org. These cells were rotated so that their dendrites are placed vertically. Blue histograms show the length of the axon in each 50 μm bin in two axes. Axon morphologies are indicated by blue lines with the red star showing the location of the soma. Green rectangles show where the axon was cut consistently with the size of a typical slice (‐500 μm to 500 μm from the soma in the length of the slice, ‐500 μm to 800 μm in the height and ‐200 μm to 200 μm in the width of the slice). Green histograms show the length of the axon remaining after the cutting. B, the distribution of the excitatory synapses in the model for Cell A (left) and Cell B (right). The distribution follows the distributions calculated by the length of the axon in A, but with constraints given by the morphologies of the postsynaptic cell population. Four randomly chosen morphologies of postsynaptic cells were drawn for easier visualisation of the spatial relations. C, local field potential plotted at 5.5 ms after the beginning of the simulation with four electrode arrays (a–d) placed at ‐200, 0, 100 and 300 μm from the presynaptic cell soma. D, traces recorded by each of the electrode arrays marked as a–d. st l mol – stratum lacunosum moleculare, st rad – stratum radiatum, st luc – stratum lucidum, st pyr – stratum pyramidale, st o – stratum oriens. [Color figure can be viewed at wileyonlinelibrary.com]
