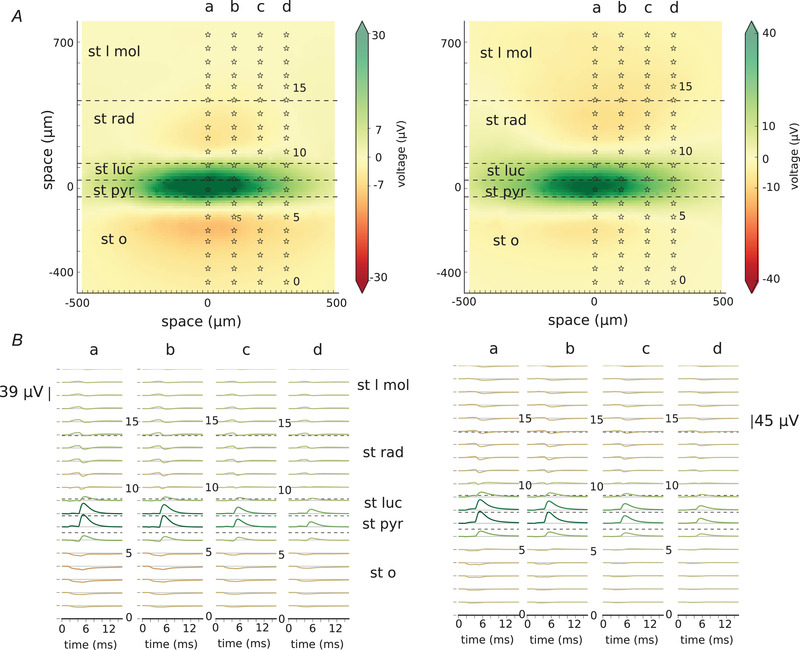
Figure 7. Masking of excitatory unitary local field potentials (uLFP) with inhibitory uLFP. Results for Cell A are on the left and for Cell B are on the right.

A, local field potential at time 5.5 ms from the beginning of the simulation. At time 1 ms, excitatory synapses were activated (of Cell A on the left, of Cell B on the right) followed by the activation of inhibitory synapses at time 3 ms. Stars show the location of the electrodes belonging to the arrays marked a–d. B, traces showing recordings from the electrode arrays marked a–d in A. st l mol – stratum lacunosum moleculare, st rad – stratum radiatum, st luc – stratum lucidum, st pyr – stratum pyramidale, st o – stratum oriens. [Color figure can be viewed at wileyonlinelibrary.com]
