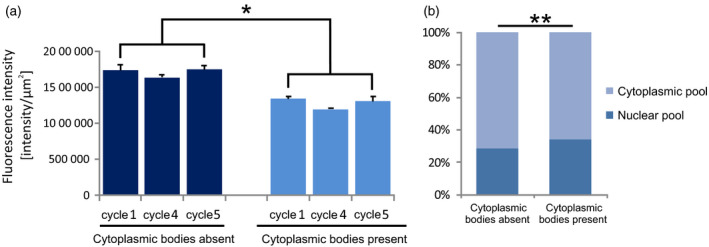
Figure 4.

Quantitative analysis of the markers for transcriptional activity (RNA pol II and 5S rRNA). (a) Quantitative analysis of the active level of RNA polymerase II in the different cycles of poly(A) RNA synthesis in the presence and absence of S‐bodies in the cytoplasm of the cell. The error bars indicate the standard errors of the mean (SEMs); *P < 0.05. (b) Analysis of the nucleus:cytoplasm ratio of 5S rRNA in cells containing and not containing S‐bodies; **P < 0.01.
