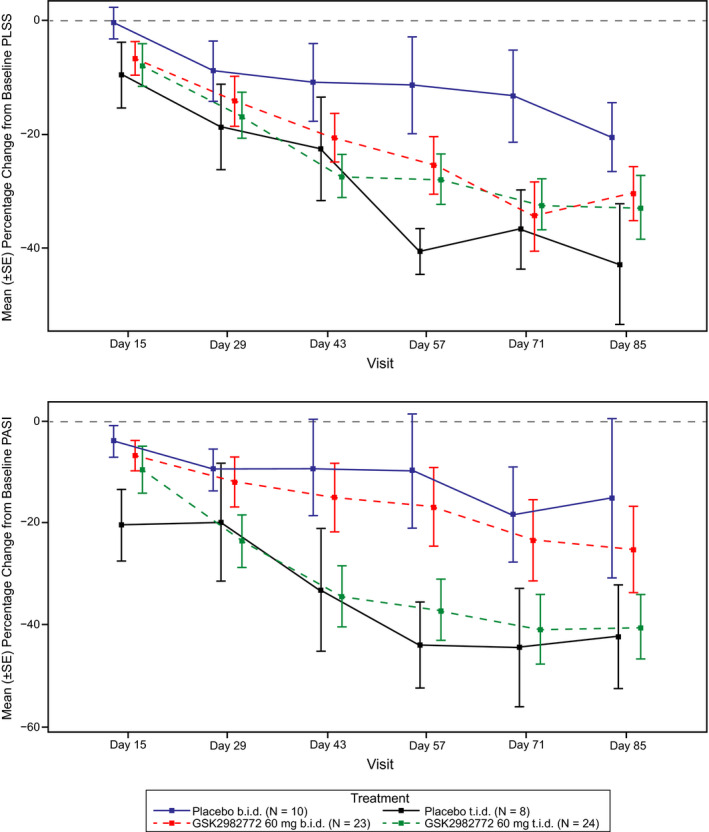
Figure 3.

Plots represent mean (±SE) percentage change in (a) PLSS and (b) PASI scores over time by treatment group. The placebo t.i.d. group produced a higher‐than‐expected response to treatment. Representations did not adjust for baseline differences in PLSS and PASI. b.i.d., twice daily; PASI, Psoriasis Area Severity Index; PLSS, Plaque Lesion Severity Sum; SE, standard error; t.i.d., three times daily.
