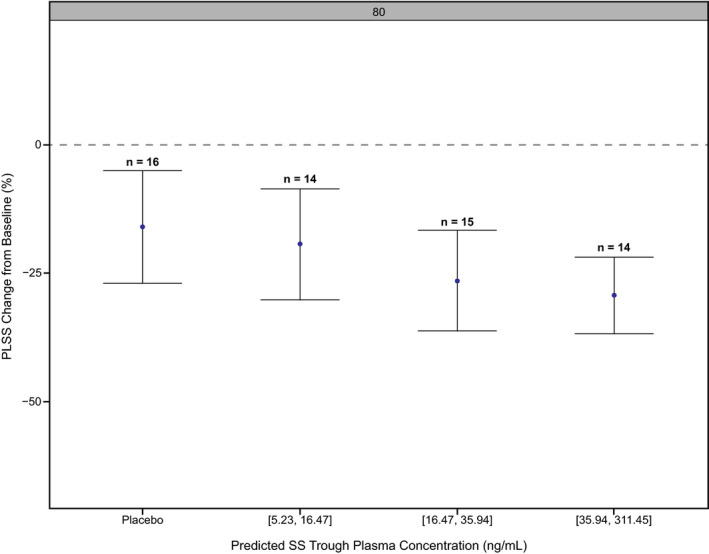
Figure 4.

Tertiles of predicted steady‐state trough plasma concentrations of GSK2982772 vs. PLSS percentage change from baseline. Values of x‐axis represent the GSK2982772 plasma concentration range for each tertile in µg/mL. Negative values indicate a reduction of PLSS score from baseline. PLSS, Plaque Lesion Severity Sum; SS, steady state.
