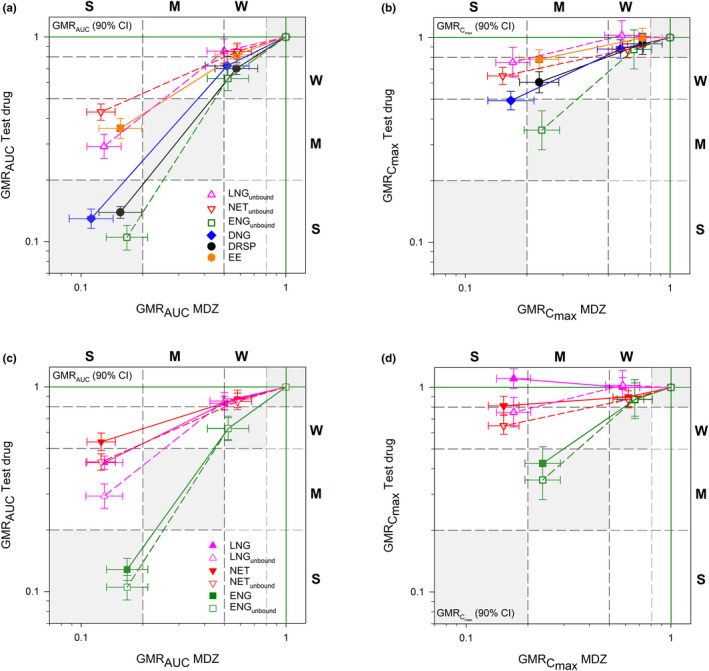
Figure 3.

Rifampicin‐dependent induction relationship between midazolam and different progestins and EE. Induction effects on AUC (a), Cmax (b) and unbound vs. total AUC (c) and Cmax (d). The magnitude of the induction effect is classified into three categories: weak induction (W, GMR > 0.5 and ≤ 0.8), moderate induction (M, GMR > 0.2 and ≤ 0.5) and strong induction (S, GMR ≤ 0.2). Gray shaded areas indicate parity of induction effects. AUC, area under the concentration‐time curve extrapolated to infinity; Cmax, observed maximum concentration; CI, confidence interval; DNG, dienogest; DRSP, drospirenone; EE, ethinylestradiol; ENG(unbound), (unbound) etonogestrel (active metabolite of desogestrel); GMR, geometric mean ratio (with RIF/no RIF); LNG(unbound), (unbound) levonorgestrel; MDZ, midazolam; NET(unbound), (unbound) norethindrone.
