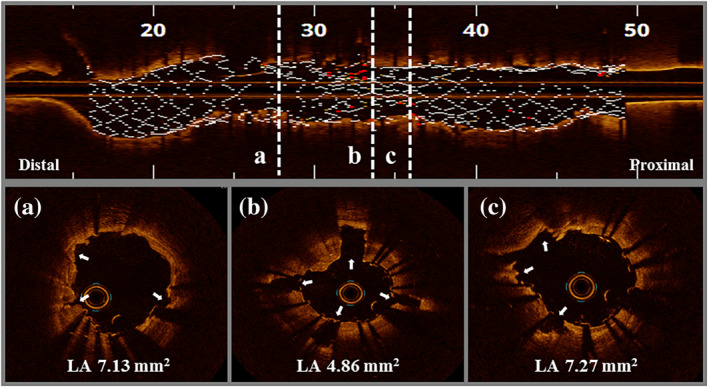
Figure 4.

Optical coherence tomography post‐lithoplasty. Optical coherence tomography of the left anterior descending coronary artery post‐intervention showing deep calcium cracks (arrows). Longitudinal view (upper row). Transversal view (bottom row). LA, lumen area [Color figure can be viewed at wileyonlinelibrary.com]
