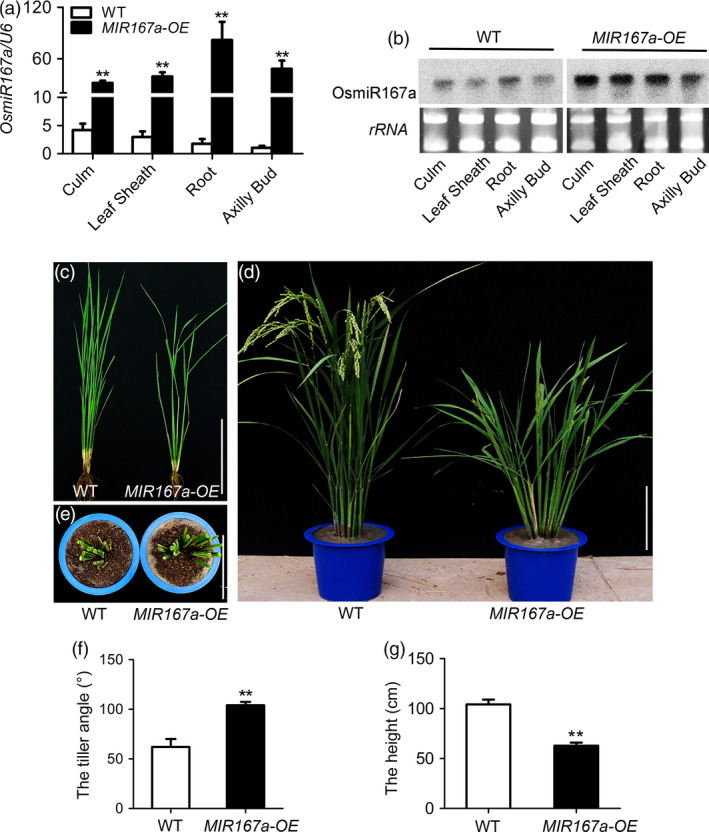
Figure 1.

Phenotypic analysis of MIR167a‐OE lines. (a, b) Expression analysis of miR167a in the culm, leaf sheath, root and axillary bud by quantitative real‐time RT‐PCR (qRT‐PCR) (a) and small RNA gel blot (b). U6 was used as a control. (c, d) Plant morphology of WT (ZH11) and MIR167a‐OE lines at tillering (c) and heading (d) stages. (e) Vertical observation of WT and MIR167a‐OE transgenic lines. (f, g) Comparison of the tiller angle (f) and plant height (g) between WT and MIR167a‐OE lines. Data are shown as means ± SE (n = 10). Bars = 20 cm. Significant at **P < 0.01.
