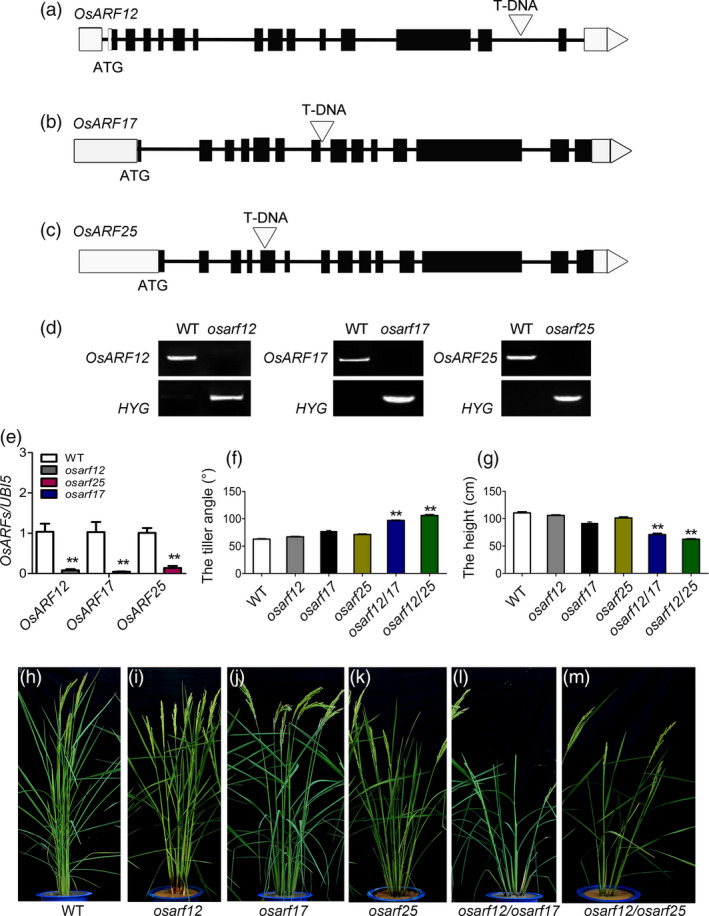
Figure 4.

Identification of OsARFs mutants. (a–c) T‐DNA insertion sites in osarf12, osarf17 and osarf25. Exons (filled boxes) and introns (lines between the filled boxes) are shown. The open triangle indicates T‐DNA insertion site. (d) PCR analysis to confirm the integration of T‐DNA in OsARF mutants; the upper band indicates the OsARF gene fragment and the lower band indicates the T‐DNA insertion fragment. (e) Expression analysis the level of OsARF12, OsARF17 and OsARF25 in WT and osarf mutants by qRT‐PCR. (f–g) Comparison of the tiller angle (f) and plant height (g) of WT and mutants. (h–m) Morphologies of WT and mutants. Bar = 20 cm. Significant at **P < 0.01.
