
FIGURE 3.
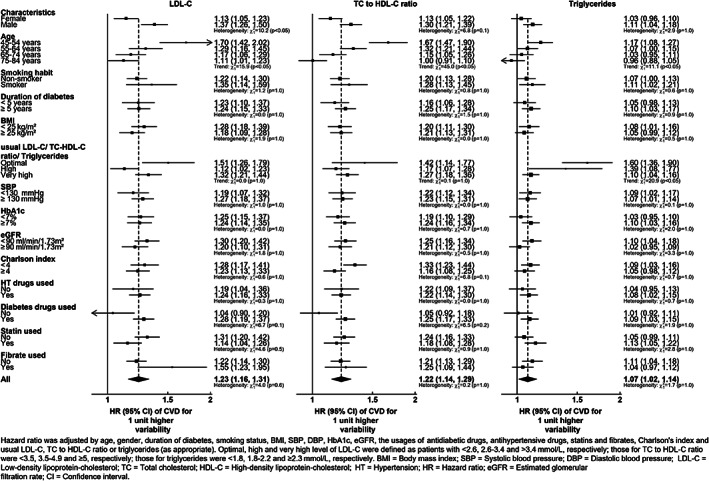
Hazard ratios for the association of a unit increase in LDL‐C, TC to HDL‐C ratio and triglyceridse variability with the composite outcome (CVD and mortality) from Cox regression models adjusted for baseline covariates. A separate model is fitted for each specified subgroup